ISSN: 0970-938X (Print) | 0976-1683 (Electronic)
Biomedical Research
An International Journal of Medical Sciences
Research Article - Biomedical Research (2017) Artificial Intelligent Techniques for Bio Medical Signal Processing: Edition-I
Design and development of mobile phone based diabetes mellitus diagnosis system by using ANN - FP-growth techniques
1Department of Computer Science and Engineering, Odaiyappa College of Engineering and Technology, Theni, Tamil Nadu, India
2Department of Computer Science and Engineering, PSNA College of Engineering and Technology, Dindigul, Tamil Nadu, India
- *Corresponding Author:
- K Sridar
Department of Computer Science and Engineering
Odaiyappa College of Engineering and Technology, India
Accepted date: January 11, 2017
Diabetes mellitus is considered to be a chronic disease that makes millions of lives miserable. Type I and Type II diabetes mellitus are caused depending upon the insulin level. Detection and diagnosis of diabetes mellitus has been performed effectively by various plasma glucose tests in the current medical systems including A1C test, fasting plasma glucose test (FPG) and oral glucose tolerance test (OGTT). Though the current diagnosis systems provide better results, the problems like imperfect concordance between the tests reduces the diagnosis accuracy. Another method of diagnosis is from the retinal images as diabetes causes retinal blindness, but these type of systems generally requires specialists to perform operation and also slightly expensive. Hence in this paper, the mobile based diabetes diagnosis system is proposed by obtaining the features from the real time inputs of glucometer with multiple measurement clinical data and retinal image features. The optimal features are selected using an optimization technique while the statistical measures are calculated for the time series data features. These features are fused together and trained using neural networks called hierarchical extreme learning machines (HELM) NN for the generation of dataset with minimum error samples. Then the association rule mining algorithm called FP-growth is employed to generate rules for determining the associations between the different sets of data. Thus the type I and type II diagnosis mellitus is diagnosed effectively with better accuracy using the proposed mobile based diabetes diagnosis system.
Keywords
Diabetes mellitus, Plasma glucose test, Hierarchical extreme learning machines (H-ELM), FP-growth, Modified particle swarm optimization (MPSO)
Introduction
Diabetes mellitus is a major metabolic disease in which the blood glucose level varies than normal over a prolonged period. There are three main types of diabetes mellitus. Type I is caused due to the pancreas failure to produce sufficient insulin. It is commonly known as insulin-depended diabetes mellitus as the disease is determined by considering the insulin level in the blood. It is caused due to the loss of beta cells in the pancreas that produce insulin. Type I diabetes is of two kinds, immune-mediated and idiopathic. Type I diabetes is partly due to inheritance, viral infections and environmental factors resulting in the death of beta cells but does not depend on lifestyle changes. Type II is commonly called as non insulin-dependent diabetes mellitus is the most common and highly affective diabetes. It is a condition in which the cells fail to respond to insulin properly due to the defective responsiveness of insulin receptor of the body tissues. The insulin sensitivity reduces continuously mainly due to the genetics and lifestyle factors. The lack of physical activity, excess fat, poor diet, stress and over dosage of sweetened drinks increases the risks of Type II diabetes. The third most common diabetes is the gestational diabetes mellitus which is common in women during pregnancy that may improve or decrease after delivery. It is quite similar to type II diabetes with inadequate insulin secretion and low response of the body cells.
Detection and diagnosis of diabetes is performed by determining the recurrent or persistent high blood glucose level. Fasting plasma glucose (FPG), plasma glucose, glycated hemoglobin (A1C test), oral glucose tolerance test (OGTT), random plasma glucose test (RPGT) are some of the most effective tests for diagnosing diabetes mellitus. Diabetes is diagnosed based on A1C criteria or the plasma glucose criteria, either the FPG value or the 2 h plasma glucose (2 h PG) value after the OGTT. Both detection and diagnosis is done by the same tests for pre-diabetes in initial stages also. Though this method is costly and the non-availability of A1C testing in all regions, with incomplete correlation between A1C and average glucose level in certain individuals, the advantages makes it the most commonly implemented diabetes diagnosis test. A1C test considers factors such as age, race/ethnicity and anemia/ hemoglobinopathies for the diagnosis. Additionally the FPG test or the 2 h PG tests are utilized however the concordance between the A1C and FPG or 2 h PG tests and also between FPG and 2 h PG is imperfect. Hence the diagnosis accuracy may be affected.
A most common method of diabetes diagnosis, other than plasma glucose tests, is the detection from the retinal images. The retinal images are generally captured using Fundus cameras with microscopic lens and then the images are trained with the normal and infected retinal images to determine the diabetes. However this retinal image system is considerably expensive and it is also required to be processed by specialists at the laboratories. Hence this method is not much possible for implementation for the general public use. Replacing the expensive components and improving the diagnosis test results by modifying the training algorithms and the data mining approach can outperform the limitations.
In order to overcome the problems in the current diabetes diagnosis systems, mobile-based diabetes mellitus diagnosis system is proposed in this paper. The proposed diagnosis system collects the real time data from the glucometer through the Bluetooth device in the mobile phones. The collected input data are transmitted to the operating system through Wi-Fi and are processed. The retinal images are captured using the mobile phone cameras and then are transmitted to the operating system in a similar fashion. Likewise the multiple measurement clinical data are also input into the processing system. The features from these collected data are extracted and by using a Modified Particle Swarm Optimization (MPSO), the optimal features are selected. Similarly the statistical measures are computed for the time series data features and are fused with the optimal features. Then the samples are trained using back propagation NN but it has infinitesimal step size problem that cannot be resolved in standard back propagation algorithm. Hence we use a special type of neural network called Hierarchical Extreme Learning Machine (H-ELM) NN in which the dataset is generated with selected minimum error samples. In order to determine the presence of diagnosis, the association rules are generated using Apriori algorithm but it is very costly due to the candidate selection process. Hence we use the FP-growth algorithm for generating association rules with which the relation between the features is estimated. Thus the diabetes can be diagnosed accurately using the proposed mobile based diabetes diagnosis system.
The remainder of the paper is organized as follows: Section 2 describes the previous research methods for the strategies utilized in the diagnosis of diabetes that form the basic motivation of our research. Section 3 explains the mobilebased diabetes diagnosis system with detailed illustration of the research methodologies. Section 4 presents the performance evaluation results of the proposed diagnosis systems. Section 5 concludes the research work and provides directions for the future research.
Related Works
Bourouis et al. [1] presented a low cost and innovative development of Smartphone based intelligent system with microscopic lens which allows the patients in remote areas for regular disease diagnosis and eye examinations. The proposed work used Artificial Neural Network algorithm for analyzing the retinal images to identify the condition of the retinal diseases. Karan et al. [2] proposed a novel approach for the diagnosis of diabetes with the help of neural networks and other computing technologies. The proposed work presented the initial results for a simple client and server two-tier architecture for healthcare. However it had higher computational complexity. In Andrea et al. [3] the study of a smart phone enabling access to daily web based diaries and also to the written feedback of an individual. The smart phones were used to register patients eating behavior to emotions thrice a day by also registering their fasting blood glucose level.
Erkaymaz et al. [4] proposed a new approach for diagnosis of diabetes based on the Small-World Feed Forward Artificial Neural Network (SW-FFANN). The classification performance of the SW-FFANN was better than that of the conventional FFANN. This work is high of cost and architecture. Roychowdhury et al. [5] proposed a computer-aided screening system called DREAM where the fundus images with varying illumination and fields of view were analyzed. The system generated a severity grade for diabetic retinopathy (DR) using machine learning method. Classifiers such as Gaussian Mixture Model (GMM), k-nearest neighbor (kNN), support vector machine (SVM), and AdaBoost were also analyzed for classifying retinopathy lesions from normal ones. This system was tested on 1200 images from the publicly available MESSIDOR data set that gave satisfactory results on the classification. But the implemented system was not applicable for data corresponding to increased coverage. Mohammad et al. [6] discussed on the Hypoglycemia which is one of the most common neonatal disorders, associated with severe complications. There has been a great deal of controversy regarding the definition and screening of hypoglycemia. A cutoff value for blood glucose level in glucometer readings were proposed based on the study conducted on 238 newborns at risk of hypoglycaemia.
Gaikwad et al. [7] presented a study was to compare blood glucose in capillary finger-prick blood and gingival crevice blood using a self-monitoring blood glucose device among patients with gingivitis or periodontitis. Thirty patients with gingivitis or periodontitis and bleeding on probing (BOP) were chosen. The following clinical periodontal parameters were noted: probing depth, BOP, gingival bleeding index, and periodontal disease index. Bin-Sabbar et al. [8] proposed the implementation of an integrated monitoring tool for the diabetes patients. The designed system provides a daily monitoring and monthly services. The daily monitoring includes recording the result of daily analysis and activates to be transmitted from a patient’s mobile device to a central database. The result of this visit entered into the system and then synchronized with the central database. Finally, the endocrinologist can remotely monitor the patient record and adjust the treatment plan and the insulin doses if need. Singhal et al. [9] provide a medical image processing system based on colorimetric detection particularly for diabetic patients that will measure the blood glucose levels by scanning an image of the visual glucose test strip using a smart-phone.
Chikh et al. [10] discussed about Artificial Immune Recognition System (AIRS) was one of the methods that used in medical classification problems where AIRS2 was an efficient version of the AIRS algorithm. The proposed work modified AIRS2 called MAIRS2 where the K- nearest neighbors algorithm was replaced with the fuzzy K-nearest neighbors in order to improve the diagnostic accuracy of diabetes diseases. Bob Zhang et al. [11] proposed a noninvasive method to detect DM and non proliferative diabetic retinopathy (NPDR). Initially three groups of features were extracted from the images of retina. A color gamut was established with 12 colors representing the features of the images. 13 features were extracted from tongue images based on measurements, distances, areas, and their ratios represent the geometry features. Applying a combination of the 34 features, the proposed method can separate Healthy/DM tongues as well as NPDR/DM-sans NPDR (DM samples without NPDR) tongues using features from each of the three groups with average accuracies of 80.52% and 80.33%, respectively, but has high resistance to noisy images. Silva et al. [12] proposed a Bluetooth prototype low power battery-less wireless sensor communication system that transmits information to a mobile phone or windows PC application. Low Power Bluetooth was used in conjunction with harvesting RF methods which allowed the development of new wireless battery-less sensors may work for years without battery replacement.
Mobile-Based Diabetes Diagnosis System
In this section, the development of the proposed mobile-based diabetes diagnosis system is illustrated in detail. The proposed diagnosis system utilizes the features from the multiple measurements clinical data, real time input from the glucometer and the retinal image features. These features are extracted using different approaches (Figure 1). The multiple measurements clinical data are collected from the patients for different time periods in between a specified time interval. Different parameters are considered from the clinical data for the diabetes diagnosis. The parameters are separately determined for the Type I and Type II diabetes mellitus. From the previous medical researches it is found that the factors influencing the Type I and Type II diabetes are similar with the lifestyle behaviors being the only difference. Type II depends upon the lifestyle changes while the Type I diabetes does not depend upon it.

Figure 1: Block diagram of proposed mobile-based diabetes diagnosis system.
Parameters
From the Dataset, the parameters are taken for type I and II separately. Type I diabetes mellitus considers the parameters such as age, gender, family history of diabetes, Hemoglobin A1C (HbA1c), systolic blood pressure, platelet parameters, cholesterol, fast plasma glucose (FPG), impaired fasting glycaemia, impaired glucose tolerance, plasma glucose level, for the diagnosis. For diagnosing Type II diabetes mellitus, the parameters such as age, gender, cholesterol, smoking & drinking status, duration of illness, FPG, HbA1C, weight variation, number of missing teeth, Papillary bleeding index, Russell’s periodontal index and community periodontal index(CPI).
Data from glucometer
The inputs are also taken from the glucometer and also from the retinal images apart from the multiple measurements clinical data. The glucometer is utilized for the home glucose monitoring (HBGM) for patients whom are to be diagnosed with diabetes mellitus. A small drop of blood obtained by pricking of skin in fingers and is placed on a disposable test strip. The strip is read by the meter and uses it to calculate the blood glucose level which is displayed in the monitor in units of mg/dl or mmol/l. The readings from the glucometer are collected and are fed into the operating system through a mobile device. The glucometer test strips are made up of chemicals like glucose oxidase and when the blood of 0.3 to 1 μl is placed on the strip it reacts with the glucose oxidase which catalyzes the oxidation of glucose to gluconolactone. The data collected by the glucometer are transmitted to the mobile phones through the Bluetooth and from the mobiles the data is transmitted to the operating systems through Wi-Fi.
Retinal images
The retinal images are usually captured using the Fundus camera which captures high quality and high sensitive images with the microscopic lens. The image database is generated by capturing images using the zoom lens mobile cameras so that the images can be captured at home itself and transmitted to the operating systems. The images can also be taken from STARE database. The retinal images are pre-processed to remove the noise and various texture backgrounds. The green channel of the color retinal images is extracted as an RGB image that provides higher contrast between vessels and background. The approach includes the processes like binarization, skeletonization and vessel thickness measurement. Thus the features can be extracted based on the categories. These features are also transmitted to the operating systems and are utilized in the diabetes diagnosis system.
Clinical data
Multiple measurements clinical data are collected from the hospitals treating the patients. The data quality is improved by using data processing techniques like data cleaning, data integration, data transformation, and data reduction. These data with unequal collecting frequency are processed before analysis. A merging algorithm is utilized for combining the features of multiple types observed at different times. Thus a set of clinical data that are related to diabetes are gathered together.
Feature selection using modified PSO
As the elimination of the irrelevant features reduces the computational cost of the system, the optimal features are selected from the given set of input features including glucometer features, retinal features and multiple measurements clinical data features. The best features are selected using modified PSO algorithm [13]. In modified PSO algorithm, the group velocity of the particle swarm considered in the normal PSO is converted into two separate and parallel particle swarm velocity in order to improve the speed of processing the data. Feature selection is a combinatorial optimization problem in a discrete space. In modified PSO, the particle velocity and position are updated using modified equations.
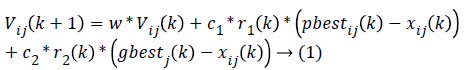
Where Vij(k) is the jth dimensional speed in the kth particles iteration, r1, r2 and rij are random numbers between 0 and 1, c1 and c2 are the learning factors, w is the weighting factor, xij(k) is the jth dimension current position of particle i in the kth iteration. pbetsij is the jth dimensional position of the individual extreme points in the particle i and gbetsij is the jth dimensional position of the global extreme points in the whole group.
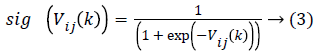
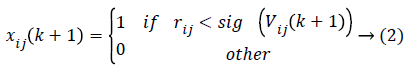
In order to prevent the saturation of sig (Vij(k)), few amendments are made. Then as stated the particle velocity given in equation (1) is converted into two velocities such that
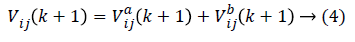
As the amendments are made, the independent particle swarms a and b does not have different speed limits so that these are the two particle groups with different steps in the search space in parallel optimization. The particle swarm with the larger step size has strong global search ability and is faster in the search space optimization, while the particle swarm with the smaller step size will have better local optimization ability. In modified PSO, to avoid the individual features pre-maturely and then lower the optimization ability, the population diversity has to be guaranteed in the optimization. In order to maintain two particle swarms in parallel, the particle position is executed as
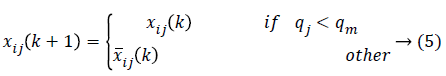
Where qj is the ratio of the number of j-dimension value (0 or 1) in particle swarm to the number of all the particles while is the convergence degree (normally 0.7-0.9).
The fitness function is given by
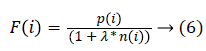
Where F(i) represents that he particle i generates the fitness value of solution; p(i) represents that the feature subset uses the mean of the correct classification rate; n(i) is the number of selected features; is the weight parameter in the features. The features are selected in the following way
• Assume a j-dimensional target search space with d-particles composing a population
• First i-particles is expressed as a j-dimensional vector Xi=(xi1,xi2,…,xij)T; i=1,2,…,m
• If X’s ith bit value is 1, the feature is selected; else it is not selected
Algorithm 1: Modified PSO for feature selection
Size of groups = m;
Initialize particle swarm a, b
Initialize random position and velocity
Adjust velocity & position of the particle using equation (2) and related equations for (4)
Evaluate fitness of each particle using (6)
For particle i=1 to number of particles
If F(i)> fitness of pbesti
Update pbesti = F(i)
For p ϵ neighborhood of F(i)
If F(p)>gbest then
Update gbest=F(p)
Next p
For each dimension j
Calculate particle velocity Vij(k)
If Vij(k) ≠ Vmax.Vmin then
Update particle velocity Vij(k)
Update particle position xij(k)
Next dimension j
Next particle
Next generation until iteration stops
Statistical measures
After optimal feature selection, Statistical measures [14] are calculated for explaining the data distribution in each period. As the selected features include time series features, they are needed to be merged together. However the information such as the tendency and the distribution of the features in the original data may disappear when data merges. In order to preserve the information, the statistical measures are computed. The maximum and minimum descriptions are utilized for illustrating the extremes of the data. Mean is a method for deriving the central tendency of a sample space, and standard deviation is a widely used measurement of variability or diversity. Variance is the measurement of contrast between the descriptions of relative features. Entropy is the measurement of disorder in the distribution of the data features. Pearson’s correlation coefficient is a statistical technique that shows whether and how strongly pairs of features are related, and express this relationship in values ranging between −1 and 1. The closer the absolute value of the Pearson’s coefficient is to 1, the correlation between the features is the stronger. Statistical measures of disease related features are also computed. The area of the disease spread is described. Mean intensity of the abnormality present in the diseased regions are computed. Using these statistical measures, the data distribution over the period of time is expressed and the lost information is also highly retained. These statistical measured features are combined with the optimally selected features using a merging technique.
Algorithm 2: Statistical measures
R=all Records before occurrence of event E
For each period t in feature subset
For each time-related feature F
F_Max t=maximum of all F in R within period t
F_Min t=minimum of all F in R within period t
F_Mean t=mean of all F in R within period t
F_SD t=standard deviation of all F in R within period t
F_Var t=variance of all F in R within period t
F_Ent t=entropy of all F in R within period t
F_Cor t=Pearson’s correlation of all F in R within period t
Add F_Max t, F_Min t, F_Mean t, F_SD t, F_Var t, F_Ent t, F_Cor t as additional features with the optimal features
End for
End for
Hierarchical extreme learning machine based neural networks for selection of minimum error samples
After the selection and merge of features, the minimum error samples are to be selected to generate a dataset from which the matching process is performed to detect the diabetes mellitus. The features are computed using the artificial neural networks due to the advantage of estimating most appropriate functions based on the large number of inputs. The back propagation algorithm is a probabilistic hill climbing algorithm that is utilized to train the neural networks. In the neural networks the neurons process the information using a connection based approach for computation. The back propagation is utilized for sending the features in the forward direction while propagating the errors in the backward directions so that the minimum error samples are selected. However the use of back propagation algorithm which uses weight in the network to determine the error functions, suffers from the step-size problem as it computes only the partial first derivative. Back propagation generally is considered to take infinitesimal steps to reduce the error at each step and achieves a minimum error function. But practically infinitesimal steps are not taken and only the larger step sizes are chosen which do not converge to a good solution. This problem can be resolved by utilizing the slope of error functions and curvature of the higher-order derivatives in weight space. But unfortunately back propagation algorithm does not include that information.
In order to generate dataset with minimum error samples using minimum error function, the neural network is trained by extreme learning machine (ELM) instead of the back propagation algorithm. The ELM approach randomly assigns hidden node parameters, the input weights and biases for additive hidden nodes. Then the hidden layer output matrix is calculated and the output weight vector is obtained using which the feature dataset can be generated by solving the regularized least mean square optimization. However the generated feature subset has redundancy and hence a more sparse solution is required which can be achieved by introducing hierarchical ELM (H-ELM) [15].
H-ELM is built in a multi-layer manner unlike the greedy layer-wise training of traditional frameworks. H-ELM is training architecture is divided into two separate phases: unsupervised hierarchical feature representation and supervised feature classification. ELM-based auto-encoder is developed for extracting the multi-layer sparse features of the input data while the ELM-based regression is utilized for the final decision making in the generation of the dataset. The optimally selected features and the statistical measured features which are fused together are transformed into an ELM random feature space in order to exploit the hidden information among the training samples. Then aN-layer unsupervised learning is performed to obtain the high-level sparse features with minimum errors. The output of each hidden layer is represented as
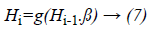
Where Hi is the output of the ith layer, Hi-1 is the output of the (i-1)th layer, g(.) denotes the activation function of the hidden layers and β is the output weights.
In H-ELM, each hidden layer is an independent module and the functions are a separated feature extractor. When the layers increases the resulting features become compact. Once the feature of the previous hidden layer is extracted, the parameters of the current hidden layer will be fixed, and need not be finetuned. As retraining the NN is iteratively performed, the training using H-ELM is faster than traditional methods.
After the unsupervised hierarchical training is completed, the resultant outputs of the kth layer are considered as the highlevel features extracted from the input feature space. These extracted features are randomly perturbed and are utilized as input to the supervised ELM-based regression to obtain the final feature sets that can be included in the dataset. H-ELM is developed on the random feature mapping for enhancing the learning speed and exploits the universal approximation capability of the ELM in both feature learning and classification. Thus H-ELM reduces the number of neural nodes and improves the testing time while also effective in retaining the lost information for the best generation of dataset with minimum error samples.
Association rule mining using frequent patterngrowth (FP-growth) algorithm
Association rules are the probabilistic relationship between two sets of data or features. In mobile based diabetes diagnosis, the association rules are generated to determine the relation between the training and testing feature sets. Apriori algorithm has been previously utilized for the detection of associations between the feature sets using the association rules generated. Each set of data has a number of items and is called a transaction. The output of Apriori is the sets of rules that determine the frequency of items are contained in sets of data. However, for the candidate generation the apriori algorithm utilizes more memory and time and also costly especially when there are large number of patterns. Hence in the mobile based diabetes diagnosis system, the apriori algorithm is replaced by the FP-growth algorithm [16]. FP-growth algorithm does not generate the candidate sets like apriori and instead employs a pattern-fragment growth for determining the association rules.
In FP-growth algorithm, the larger feature space is condensed into smaller sub-spaces so that the costly repeated scans are avoided. A set of features (items) are taken and the database generated by using NN is considered. The support of a pattern is determined and then the minimum support threshold ξ is predefined using which the frequent patterns are detected and the associations between the features are exploited.
Algorithm 3: Frequent-pattern Growth algorithm
Input: Dataset D generated by H-ELM based NN; minimum support threshold ξ
Output: Complete set of frequent patterns
Call FP-growth (FP-tree, null)
Let P be the single prefix-path part of Tree
Q be the multipath part with the top branching node replaced by a null root
Freq_pattern_set(P) and Freq_pattern_set(Q) be the generated set of patterns
FP-growth (Tree, α)
If Tree contains single prefix path then
For each combination β of the nodes in the path P do
Generate pattern ß U α with support = minimum support of nodes in β
Freq_pattern_set(P)
End for
Else assign Q as Tree
For each items (features) k in Q do
Generate pattern ß=k U α with support = k.support
Construct β’s conditional pattern-base and then β’s conditional FP-tree Treeβ
If Treeβ = null then
Call FP-growth (Treeβ, β)
Freq_pattern_set(Q)
End if
End for
End if
Return
(Freq_pattern_set (P) ∪ Freq_pattern_set (Q) ∪ Freq_pattern_set (P) × Freq_pattern_set (Q))
The three frequent pattern sets generated using the FP-growth algorithm, are considered to be the association rules that determine the relation between the feature sets. Using the relations detected between the features, the presence or absence of diabetes can be diagnosed effectively and the results are displayed in the mobile phones.
Experimental Results
In this section, the performance of the proposed Mobile-based diabetes diagnosis system is evaluated in terms of accuracy, precision, recall and time consumed. The evaluation results are compared with methods namely Diabetes retinopathy [5] and Diagnosis using BP-NN& apriori algorithm [17] to determine the efficiency of the proposed diagnosis system. The input data are taken from real-time dataset collected from patients and from STARE database along with the data extracted from glucometer results. The better diagnosis method must help in detecting the diabetes accurately and in less time. The experimental results are conducted and comparison graphs are given below in Table 1.
| Methods | Accuracy (%) | Precision | Recall | Time (min) |
|---|---|---|---|---|
| Diabetes retinopathy | 84 | 0.80 | 0.78 | 32 |
| Diagnosis using BP-NN & apriori algorithm | 89 | 0.86 | 0.85 | 18 |
| Mobile-based diabetes diagnosis system | 96 | 0.91 | 0.93 | 12 |
Table 1. Performance evaluation results.
Accuracy
Accuracy is defined as the exact diagnosis of the disease without any false detection.
Figure 2 shows the comparison of the diagnosis methods in terms of accuracy. When the data are processed, the accuracy of diabetes retinopathy method is 84%, Diagnosis using BPNN & apriori algorithm is 89% and the proposed Mobile-based diabetes diagnosis system is 96%. Hence it is clear that the Mobile-based diabetes diagnosis system outperforms other methods in terms of accuracy during diagnosis of diabetes.

Figure 2: Accuracy comparison.
Precision
Precision is the measurement of refinement or exactness of the diagnosis system.
Figure 3 shows the comparison of the diagnosis methods in terms of precision. When the data are processed, the precision of Diabetes retinopathy method is 0.8, Diagnosis using BP-NN & apriori algorithm is 0.86 and the proposed Mobile-based diabetes diagnosis system is 0.91. Hence it is clear that the Mobile-based diabetes diagnosis system outperforms other methods in terms of precision during diagnosis of diabetes.

Figure 3: Precision comparison.
Recall
Recall is the relevancy in the output of the diagnosis system with respect to the presence of diabetes.
Figure 4 shows the comparison of the diagnosis methods in terms of recall. When the data are processed, the recall of diabetes retinopathy method is 0.78, Diagnosis using BP-NN & apriori algorithm is 0.85 and the proposed Mobile-based diabetes diagnosis system is 0.93. Hence it is clear that the Mobile-based diabetes diagnosis system outperforms other methods in terms of recall during diagnosis of diabetes.

Figure 4: Recall comparison.
Time consumption
It is the time taken for a diagnosis system to diagnose the presence of diabetes from the given input data. Figure 5 shows the comparison of the diagnosis methods in terms of time consumed. When the data are processed, the diabetes retinopathy method takes 32 minutes, Diagnosis using BP-NN & apriori algorithm takes 18 minutes and the proposed Mobilebased diabetes diagnosis system takes 12 minutes. Hence it is clear that the Mobile-based diabetes diagnosis system outperforms other methods and processes data within less time. Thus from the experimental results it can be concluded that the proposed Mobile-based diabetes diagnosis system performs better than the other compared methods in terms of accuracy, precision, recall and time consumption for diagnosis.

Figure 5: Time consumption.
Conclusion
Mobile-based diabetes diagnosis system proposed in this paper helps in diagnosing the pre-diabetes and also in detecting the current status of the patients from the home itself in a more convenient manner. The proposed Mobile-based diabetes diagnosis system utilizes data from glucometer, retinal images of patients and the clinical data gathered to detect the type I and Type II diabetes effectively. The Features are extracted from the input data and the optimal features are selected using a modified PSO. Then the statistical measures are calculated and these features are merged with the optimal features. The feature space thus formed is processed in H-ELM based NN to generate a dataset with minimum error samples. Then the association rules are generated using FP-growth algorithm to determine the relation between the features In order to detect the presence of diabetes in the specified patient data. Experimental results also show that the proposed Mobile-based diabetes diagnosis system helps in diagnosing diabetes more accurately.
References
- Bourouis A, Feham M, Hossain MA, Zhang L. An intelligent mobile based decision support system for retinal disease diagnosis. Decision Support Systems 2014; 59: 341-350.
- Karan O, Bayraktar C, Gümüşkaya H, Karlık B. Diagnosing diabetes using neural networks on small mobile devices. Expert Syst Appl 2012; 39: 54-60.
- Nes AA, van Dulmen S, Eide E, Finset A, Kristjánsdóttir ÓB, Steen IS, Eide H. The development and feasibility of a web-based intervention with diaries and situational feedback via smartphone to support self-management in patients with diabetes type 2. Diabetes Res Clin Practice 2012; 97: 385-393.
- Erkaymaz O, Ozer M. Impact of small-world network topology on the conventional artificial neural network for the diagnosis of diabetes. Chaos Solitons Fractals 2016; 83: 178-185.
- Roychowdhury S, Koozekanani D, Parhi K. Dream: Diabetic retinopathy analysis using machine learning. IEE J Biomed Health Informat 2014; 18: 1717-1728.
- Torkaman M, Bagheri G, Ahmadi A, Saburi A. A Comparative Study of Blood Glucose Measurements Using Glucometer Readings and the Standard Method in the Diagnosis of Neonatal Hypoglycemia. Iran J Neonatol 2016; 7: 41-46.
- Gaikwad S, Jadhav V, Gurav A, Shete AR, Dearda HM. Screening for diabetes mellitus using gingival crevicular blood with the help of a self-monitoring device. J Periodont Implant Sci 2013; 43: 37-40.
- Bin-Sabbar MS, Al-Rodhaan MA. Diabetes monitoring system using mobile computing technologies. Diabetes 2013.
- Singhal S, Ralhan P, Jatana N. Smartphone-based colorimetric detection to measure Blood Glucose Levels. In Contemporary Computing (IC3), Eighth International Conference, IEEE, 2015.
- Chikh MA, Saidi M, Settouti N. Diagnosis of diabetes diseases using an artificial immune recognition system2 (AIRS2) with fuzzy k-nearest neighbor. J Med Syst 2012; 36: 2721-2729.
- Zhang B, Kumar BV, Zhang D. Detecting diabetes mellitus and nonproliferative diabetic retinopathy using tongue color, texture, and geometry features. IEEE Transact Biomed Eng 2014; 61: 491-501.
- Silva S, Martins H, Valente A, Soares S. A bluetooth approach to diabetes sensing on ambient assisted living systems. Procedia Comput Sci 2012; 14: 181-188.
- Zhu W, Hou D, Zhang J, Zhang J. Optimization of a subset of apple features based on modified particle swarm algorithm. In Intelligent Information Technology and Security Informatics (IITSI), Third International Symposium, IEEE, 2010.
- Tseng YJ, Ping XO, Liang JD, Yang PM, Huang GT, Lai F. Multiple-Time-Series Clinical Data Processing for Classification With Merging Algorithm and Statistical Measures. IEEE J Biomed Health Informa 2015; 19: 1036-1043.
- Tang J, Deng C, Huang GB. Extreme learning machine for multilayer Perceptron. IEEE Transact Neural Networks Learning Syst 2016.
- Han J, Pei J, Yin Y, Mao R. Mining frequent patterns without candidate generation: A frequent-pattern tree approach. Data Mining Knowledge Discov 2004; 8: 53-87.
- Sridar K, Shanthi D. Medical Diagnosis System for the Diabetes Mellitus by using Back Propagation-Apriori Algorithms. J Theor Appl Informa Technol 2014.