ISSN: 0970-938X (Print) | 0976-1683 (Electronic)
Biomedical Research
An International Journal of Medical Sciences
Research Article - Biomedical Research (2017) Volume 28, Issue 2
Comparison of segmentation algorithms for detection of hotspots in bone scintigraphy images and effects on CAD systems
1Technical and Vocational High School, Mehmet Akif Ersoy University, Burdur, Turkey
2Department of Computer Engineering, Bilecik Şeyh Edebali University, Gulumbe Campus, Bilecik, Turkey
3Department of Mechatronics Engineering, Sakarya University, Sakarya, Turkey
- *Corresponding Author:
- Murat Çakiroglu
Department of Mechatronics Engineering
Sakarya University, Sakarya, Turkey
Accepted date: June 10, 2016
The bone scintigraphy scan is one of the most common diagnostic procedures in nuclear medicine for detection of bone metastases. All involvements detected by the imaging process are called hot spots, whether or not they indicate metastasis. Our major concern is the successful segmentation of hot spots, which affects the accuracy of CAD systems developed for the detection of bone metastases. This study examined the extent to which segmentation algorithms can affect the success rate of CAD systems, both in terms of time and of making a correct decision. There is no perfect segmentation algorithm that will provide excellent results for all image types. Using a system developed by the authors, the present study compared several segmentation algorithms for detection of hot spots. Three algorithms known to provide the best results (FCM, SOM, and LSAC) were examined for all details and from different angles. Their performance was measured as 54%, 79%, and 88%, respectively, confirming LSAC as the most appropriate segmentation algorithm. Data obtained by application of the segmentation algorithms were used as input to an artificial neural network model, and the accuracy of the CAD system was measured for each segmentation method. CAD system accuracy rates are 92.3% for LSAC, 86.93% for SOM and 84.62% for FCM. The tolerance of other the segmentation algorithms (FCM and SOM) was measured with reference to LSAC, returning error rates of 7.68% for FCM and 5.37% for SOM. In experimental studies of a total of 706 pelvises, whole body, and chest images, results indicate that more successful segmentation increases the accuracy of CAD systems.
Keywords
Bone scintigraphy, Fuzzy-C means, level set active contour, Metastases, SOM, CAD.
Introduction
Cancer is a broad group of diseases involving uncontrolled cell growth, representing a major health problem worldwide. When cells grow in an uncontrolled way, a lump known as a tumour is formed. If the tumour is not treated, it may cause problems that include pressure on other parts of the body or spread to neighbouring tissues or to more distant structures through the bloodstream or lymphatic system, which is called metastasis. It has been estimated that 12 million people will be death due to cancer by 2030 [1]. However, the mortality rate among cancer patients can be reduced with early detection and healthy treatment process. With early diagnosis, a significant percentage of cancer cases can be cured by radiotherapy, surgery, or chemotherapy, making it essential to fully exploit advanced technological developments for early detection and diagnosis.
A bone scan or bone scintigraphy is a nuclear scanning test to identify certain abnormalities in the bone, primarily to help diagnose a number of conditions that include cancer of the bone or cancers that have spread (metastasized) to the bone. The nuclear medicine technique involves injecting the patient (usually into a vein in the arm or hand or, occasionally, in the foot) with a small amount of radioactive material (e.g., 740 MBq of technetium-99 m-MDP) and then scanning with a gamma camera, a device sensitive to the radiation emitted by the injected material. Bone scintigraphy accounts for approximately one-third of all nuclear medicine applications and helps to determine treatment strategies by providing important physiological information such as bone blood flow and bone metabolism. Bone scintigraphy is applied as a wholebody imaging technique for the investigation of all skeletal metastatic disease, including malignant metastases in bone tumours and bone and soft tissue infections [2].
The more diagnostic images radiologists must examine, the greater is the rate of cancer and associated concerns [3]. The complexity of the process and demands on time mean that radiologists spend efficiency on diagnosis, which depends in part on the person viewing the images. An expert can extract more abnormal findings than the others; conflicting diagnoses indicate that such differences depend on the person. One of the most effective methods for resolving these conflicts is to develop a computer system that will warn radiologists about suspect diagnoses.
Background
The number of existing studies on this subject is limited; the works cited here deal mainly with the accuracy, specificity, and use of segmentation algorithms. A computer-aided diagnosis system developed by Huang et al. achieved sensitivity of 92.1%, with a false detection error rate of 7.58% [4]. This system used the fuzzy histogram thresholding method to segment images into 46 regions, using standard deviation as a final step for detection of bone lesions. The decision support system developed by Ohlsson et al. had a sensitivity of 95%, with a ratio of specificity of 64% [5]. In this study ATLAS was used to segment the body into 12 regions. For segmentation of hot spots, they used a band pass filtered version of the image. Another CAD system, developed by Erdi et al. [6], estimated the survival rate of prostate cancer patients by use of the region growing method. In that system, the physicians placed a seed into a specific bone lesion, and the computer then focused on this area; this method can be classified as semi-automatic. Recently, Yin and Chiu [7] have used a characteristic pointbased fuzzy inference system (CPFIS) to locate bone lesions. In their study, local maximum segmentation was used for detection of bone lesions. Based on the results of segmentation, brightness and asymmetry were estimated as data inputs to CPFIS. The sensitivity ratio was 91.5% (227 of 248), and the rate of false positives (FPs) was 37.3%. Sajn et al. [8] developed the first completely automatic method for scanning bones and diagnosing the entire body. They used two-way Gaussian filtering for detection of edges, which are the key reference points to be used later for region localization. The support vector machine (SVM) algorithm and ArTeX were used for the purposes of diagnosis. Sajn et al.’s method achieved a sensitivity ratio of 79.6% and a specificity ratio of 85.4%. Adopting segmentation algorithms that included an active shape model for segmentation of the skeleton and a region-specific threshold algorithm for hot spot detection, Sadik et al. [9] used artificial neural networks to detect bone lesions. The method achieved a sensitivity of 90% and a specificity of 89%. Horikoshi et al. [10] used the same method for segmentation and hot spot detection but with a Japanese database. According to their results, the software trained on the Japanese database achieved significantly higher performance; this difference in results might be accounted for by physical differences between European and Japanese patients. Al-Rifaic et al. [11] used Stochastic Diffusion Search, a swarm intelligence algorithm, to define metastasis; this method is used for training junior doctors and medical students. The artificial neural network (ANN)-based bone scan index (BSI), developed by Nakajima et al. [12], is used to identify the extent of bone metastasis. Regions inside a delineated skeleton with intensities exceeding a threshold are defined as hot spots. This threshold can vary across different parts of the skeleton. The method is used to increase the reproducibility and accuracy of diagnosis. In another study by Tokuda et al. [13], a system called BONENAVI version 1 used a region-specific threshold algorithm for hot spot detection, examining the system according to cancer type. The metastatic effect of each type of cancer differs, and it has been observed that different systems do not achieve good results for some cancer types. For that reason, it will be important to develop systems for all types of cancer.
The techniques used in CAD systems have a major impact on system performance. At this point, the present study diverges from the detail of previous work examining the effect of segmentation algorithms for hot spot detection on CAD systems, as a comparison of algorithms in the field of bone scintigraphy is considered useful for present purposes.
The rest of the study is organized as follows: In section 2, a brief outline of CAD system and mathematical foundations of compared segmentation algorithms are presented. Section 3 explains experimental results on CAD system performance. Final section is discussion and conclusion.
Materials and Methods
This section composed of image dataset, proposed CAD system, segmentation methods on hot spot segmentation.
Scintigraphy image dataset
In the present study, 706 images that belong to 75 patients were used in the segmentation process, including whole body, pelvis, and chest images; 150 of these were whole body bone images. Details of the 75 patients used to determine the accuracy of the segmentation process are set out in Table 1. Nuclear medicine uses front and rear body images to determine whether the patient has metastases. Pelvis, chest, or spot images taken from other parts of the body indicate a decision to examine the patient in greater detail when cancer is suspected. Some of the patients had only spot images, and then we could not use these patients in the CAD system. Therefore, the number of patients used to test CAD system and segmentation are different. All images were used to determine hotspots.
| Parameters | Values |
|---|---|
| Number ofpatients | 75 |
| Sex | 45 Male, 30 Female |
| Mean age | 53 (range 26-89) |
| Number of images | 706 |
Table 1: Study population.
The image formats used were DICOM and JPEG; DICOM data were converted to JPEG format before processing.
Data were obtained from Suleyman Demirel University Medical School and from Konya Education and Research Hospital.
The CAD system evaluation was based on 60 of 75 patients and 150 whole-body bone scintigraphy images, taken between 2003 and 2013. The cases involved breast, prostate, and lung cancer, which are widely seen in Turkey. Technically suitable images were selected for use in the study; some images were eliminated for reasons such as low resolution or faulty shooting. In total, 130 images were used to test the system, of which 100 images related to metastasis patients. Tenfold crossvalidation was used during the training and test phases. Sixty per cent of the patients were male, and the average age was 57, with a range of 30 to 87. Most of the patients were aged over 55 years. Of the 60 patients, 20 did not have metastases. BS images were performed using 740 MBq (20 mCi) Tc-99 m MDP. Images were obtained 3 h after 99 mTc-MDP injection using a 15 cm/min rate throughout the entire body for at least 500,000 counts.
CAD system
CAD systems consist of pre-processing, hotspot segmentation, feature extraction, feature selection, and classification, as shown in the block diagram in Figure 1. Pre-processing is used to strengthen hotspots to increase the accuracy of values at the end of the segmentation process. Feature extraction is performed following hotspot segmentation. Because of the great number of factors that can impact negatively on the efficiency of the system, the number of properties was reduced here by using principal component analysis prior to the classification process (metastases or not). Details of CAD system was explained in previous study [14].

Figure 1: Flowchart of CAD system.
Hot spot segmentation
There is no segmentation method that can be applied to all types of disease or image. In short, selection of an appropriate segmentation method depends on the characteristics of the problem to be solved and the structural features of the image [15]. In the present study, we will examine only the most relevant segmentation methods: SOM, LSAC, and FCM, many derivatives of which are reported in the literature. There follows a brief outline of segmentation algorithms used in this paper.
Fuzzy C-means
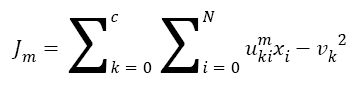
The Fuzzy C-means (FCM) determines category of each pixel using fuzzy memberships [16]. It allows more precise computation of cluster membership. This algorithm has been also used successfully for image clustering and for segmentation of medical, geological, and satellite images [17]. The original FCM algorithm was used in the present study. Let X=(xi, i = 1, 2 . . ., N) show an image with N pixels. Here, xi represents feature data. Suppose that we want to divide into c clusters this image. FCM algorithm minimizes iteratively the objective function defined as Equation 1.
 →(1)
→(1)
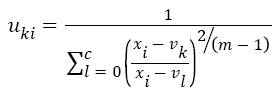
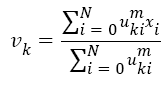
Here, uki denotes the membership of pixel xi in the kth cluster. vk is the kth class centre and || . || shows the Euclidean distance. The parameter m controls the fuzziness. The membership functions and cluster centres are updated according to Equation 2 and Equation 3.
 →(2)
→(2)
 →(3)
→(3)
Figure 2 presents examples of Fuzzy C-means for bone scintigraphy images.

Figure 2: FCM segmentation results.
Self-organizing map network (SOM)
A self-organizing map (SOM), a type of artificial neural network, is a dimension reduction process that aims to decrease the size of multi-dimensional inputs to reduce the size of outputs. Organizing map neural networks are distinguished from other ANN by their use of the neighbourhood function, which protects the topological properties of the input space [18]. The SOM receives input in the form of vectors and divides these into groups. Each group must have similar characteristics in terms of input values [19]. The SOM algorithm is summarized below.
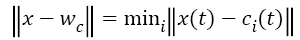
The training of the SOM network is the process of determining the optimal weight vector using the input pattern of the network. For each input pattern i, there is a wi=(wi1,wi2,.......wim) weight vector in each t iteration. There is a winner neuron for each input sample (c) and each winning neuron is calculated by using Equation 4. || . || Symbol shows Euclidean distance measurement in Equation 4.
 →(4)
→(4)
After determining the winning neuron, both c and weight values of identified neighbouring neurons is calculated by using Equation 5.
 →(5)
→(5)
t+1 refers to next iteration, α (t) learning rate, hci seen in Equation (6) to the neighbouring function of winning neuron usually identified as a Gauss function.
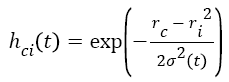 →(6)
→(6)
Where ri shows the position of the i. unit on the map ve rc the position of the winning unit on the map.
The algorithm has a repeating structure. Each iteration is called an epoch. In each iteration, the algorithm takes input vectors and finds the closest node (in terms of features) to the current input record. The closest node is selected as the winning node. The nodes around the winning node are adjusted by pulling it closer to the input node [20]. The SOM algorithm grew out of early neural network models, especially models of associative memory and adaptive learning. The first application area of the SOM was speech recognition. In its abstract form, the SOM has come into widespread use in data analysis and data exploration [21]. Sample SOM results are shown in Figure 3.

Figure 3: SOM segmentation results.
Level set active contour
Deformable models are active contour models used to assess geometric size and shape of abnormal growth in any organs, tumours, lesions, and so on as identified by any of the medical imaging modalities [22]. Active contour model (known as snakes) are one example of the general technique of matching a deformable model to an image, using energy minimization. From any starting point, a snake will deform into alignment with the nearest salient feature in an image; such features correspond to local energy minima created by processing the image. Unlike most other techniques, snakes are always active [23].
Here, the method we used for image segmentation in the level set framework was based on a study by Li. Intensity inhomogeneity occurs in many real images, especially in medical images such as X-ray radiography/tomography and magnetic resonance (MR) images because of technical limitations or artefacts introduced by the object being imaged [24]. These intensity inhomogeneity images include bone scintigraphy images. Figure 4 clearly shows inhomogeneity in the histogram of bone scintigraphy images. The chosen method efficiently utilizes local image information and is therefore able to segment images with intensity inhomogeneity.

Figure 4: Histogram of bone scintigraphy images.
The method used in this study has older derivatives called as Mumford-Shah functional [25], Piecewise constant [26] and Piecewise smooth. These studies have some advantages and disadvantages. The basic approach used in this study involves introducing a kernel function to define a local binary fitting energy in a variation level set formulation so that local intensity information can be embedded into a region-based active contour model [24]. In this method, the energy function seen in Equation 7 is redefined by using local binary fittings.
Consider a given vector valued I: Ω → Kd where Ω → Kn is the image domain, and d ≥ 1 is the dimension of the vector I (x). For gray level images, d=1, for colour images, d=3. Let C be a contour in the image domain Ω. It is defined as x ε Ω for each point of the following energy
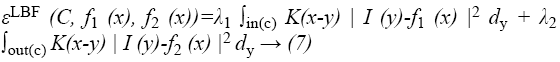
where λ1 and λ2 are positive constants, and K is a kernel function with a localization property that K(u) decreases and approaches zero as |u| increases, and f1(x) and f2(x) are two numbers that fit image intensities near the point x. It is called the point x the centre point of the above integral, and the above energy the local binary fitting (LBF) energy around the centre point x.
Gaussian is selected as a kernel function, which is one of the important parameters of energy functions Equation 8.
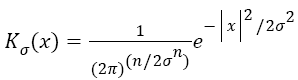 →(8)
→(8)
Energy function is then restructured again to suit the level set algorithm Equation 9. With the level set representation, the energy functional εxLBF (C, f1 (x), f2 (x)) can be rewritten as
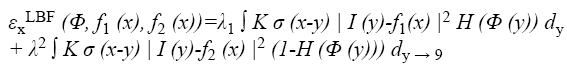
Finally, the gradient flow derivative is applied for minimization of energy function. We use the standard gradient descent (or steepest descent) method to minimize the energy functional (Equation 9). The derivation of the gradient flow is similar to that of the PC and PS models in [26,27].
Sample results of level set active contour for bone scintigraphy images are shown in Figure 5.

Figure 5: Results of LSAC segmentation.
Results
Evaluation of segmentation algorithms for hot spot detection
All experiments were performed on a PC with 4GB of RAM and a 2.53 GHz i5 processor. All segmentation algorithms were applied to images, and we prepared a tool that evaluated the performance of the algorithms by automatically comparing expert and algorithm results and generating a value. This tool expresses the value of intersection of results produced by the specialist and the segmentation algorithm as a percentage. Along with percentage success of segmentation, segmentation time was also used as a criterion. Table 2 shows examples of segmentation performance for six bone scintigraphy images used in the study. The SOM and LSAC methods seem to show more consistency than FCM with expert opinion. In relation to time, FCM and SOM segmentation can be seen to require less time than the LSAC method. As all three methods are iterative, number of iteration is important parameter as well as time. The numbers of iteration values for each segmentation algorithm are based on the optimal solution. The FCM segmentation algorithm required 100 iterations, with 300 iterations for LSAC and 1000 iterations for SOM. Given the number of iterations, it can be observed that FCM has the lowest accuracy with the least number of iterations.
| Images | Method | Accuracy | Time (s) |
|---|---|---|---|
| Figure 2a | FCM | 69 | 12.73 |
| SOM | 52 | 11.81 | |
| LSAC | 94 | 28.5 | |
| Figure 2b | FCM | 45 | 10.52 |
| SOM | 82 | 6.01 | |
| LSAC | 89 | 34 | |
| Figure 2c | FCM | 90 | 12.59 |
| SOM | 96 | 17.38 | |
| LSAC | 98 | 29.71 | |
| Figure 3a | FCM | 65 | 8.72 |
| SOM | 89 | 12.13 | |
| LSAC | 94 | 32.18 | |
| Figure 3b | FCM | 55 | 3.55 |
| SOM | 87 | 5.96 | |
| LSAC | 93 | 4.99 | |
| Figure 3c | FCM | 42 | 3.47 |
| SOM | 78 | 2.06 | |
| LSAC | 86 | 4.9 |
Table 2: Analysis of all methods presented.
Average performance of the three different segmentation methods was evaluated for all the images in the database; results are presented in Figure 6. Of the three methods, FCM achieved the lowest success rate with an accuracy of 54%; SOM achieved 79%, and LSAC achieved 88%. When accuracy, number of iterations, and time are compared across the three methods, LSAC would seem to offer the optimal solution.

Figure 6: Segmentation accuracy: average value for all images.
In addition to accuracy and time, other parameters affect the CAD system, including the capacity to produce the same results each time. Known as stability, this requirement can be a major weakness of ANN-based systems. For example, SOM fails to return the same results in all circumstances because of mapping errors. Figure 7 shows the most successful segmentation that could be achieved for the pelvis image of a patient in three attempts.

Figure 7: Segmentation of hip image using SOM.
Although it has high accuracy, the SOM algorithm shows the problems that can arise in a fully automated system. The advantages and disadvantages of the three methods are presented in Table 3, based on parameters of starting, time, and accuracy. All segmentation algorithms used in the test were initiated manually. LSAC had the most starting parameters, and this method appears to be a little more complicated than FCM and SOM because of the number of parameters.
| Parameter | LSAC | FCM | SOM |
|---|---|---|---|
| Manual Start | No | No | No |
| Starting parameters | 5 | 2 | No |
| Pre-processing | Yes | Yes | Yes |
| Accuracy | Most | Least | Better than FCM; worse than LSAC |
| Time | Least | Most | Slower than FCM; faster than LSAC |
Table 3: Advantages and disadvantages of segmentation methods.
Among the most important parameters used to follow disease progression or diagnosis is the number of involvements in the region. If the images show only a few hotspots, experts are likely to be cautious about diagnosing metastases in this area.
In the present study, the total number of hotspots in the bone scintigraphy images was calculated. The number of involvements changes according to the patient's physical structure and the amount of radiation absorbed into the body.
Both FCM and SOM identified many hotspot regions incorrectly because the edges of objects did not express a fully enclosed space. Because LSAC is based on a closed curve area, it provides more realistic results in calculating the number of hotspots.
Segmentation effects on CAD system
Final evaluations of the patients were conducted by an experienced physician to establish whether or not the patient had bone metastases. These assessments took account of intensity and size changes, increasing and decreasing values in high accumulation areas, patient medical records, results of laboratory tests, and other available radiographic images. For the final clinical evaluations, Grade 1 and 2 diagnostic criteria were applied as follows [2].
Grade 1: If no bone metastasis is observed, the scintigraphy pattern is either normal or exhibits typical hotspots associated with fractures or degenerative changes. It can be concluded that there are no radiographic or clinical data referring to bone metastases.
Grade 2: As there are visible hot spots, localized, distributed, and with intensity, there is potential for the existence of metastases. These hotspots are not typical of fractures or degenerative changes, and clinical assessment may infer the existence of bone metastases.
Segmentation is an important factor that directly affects the performance of CAD systems. Results using the LSAC segmentation method as proposed are shown in Table 4. This not only shows the result of CAD system but also result of performance of physician when using CAD system. Accuracy of the proposed CAD system only was 92.30%; expert-only accuracy was 95.38%; and combined accuracy (physician and CAD system) was 96.9%.
| Performance Criteria | CAD | Expert | CAD+ Expert |
|---|---|---|---|
| Accuracy | 92.3 | 95.38 | 96.9 |
| Sensitivity | 94 | 97.95 | 98 |
| Specificity | 86.67 | 87.5 | 90.6 |
Table 4: Comparative performance of proposed CAD system.
The data relating to LSAC and FCM segmentation were provided as input to the neural network system, and the results were again compared. As shown in Table 5, the accuracy values obtained using LSAC were significantly better than those obtained by other methods. Error rates are calculated according to LSAC-CAD.
| Parameters | SOM-CAD | FCM-CAD |
|---|---|---|
| Accuracy | 86.93 | 84.62 |
| Error rate | 5.37 | 7.68 |
Table 5: Effects of segmentation algorithms on CAD System.
Table 6 shows segmentation performance as obtained from the SVM classifier and Bayesian analysis. The results obtained using the ANN is better than those obtained using SVM and Bayes in the three segmentation methods.
| Parameters | LSAC-CAD | FCM-CAD | SOM-CAD |
|---|---|---|---|
| SVM | 84.62 | 76.92 | 74.61 |
| Bayesian | 76.92 | 69.23 | 76.92 |
| ANN | 92.3 | 84.62 | 86.93 |
Table 6: Success of CAD systems with different classification methods.
Discussion and Conclusion
In this study, the performance of different segmentation algorithms in detecting hotspots in bone scintigraphy images and the effects of segmentation on CAD performance were compared in detail. A review of the relevant literature does not make the success of segmentation algorithms explicit. According to our results, LSAC performs better than other segmentation algorithms, offering significant advantages such as region growing, watershed, edge detection, and use of a threshold value. LSAC algorithms can be formulated in terms of an energy minimization function. Global or local image information (such as shape or gray level distribution) can be used in this formulation to efficiently perform image segmentation. Number of hotspots was identified as a key factor, and LSAC is far superior to other segmentation algorithms in this respect. In particular, SOM lacks a stable structure, although in some cases, good segmentation can be achieved by SOM after several attempts.
The CAD system presented here represents an important step for medical applications in its combined use of standard image processing techniques, better segmentation algorithms, and machine learning, offering hope for the future. The human brain more easily interprets objects visually, and the proposed system distinguishes hotspots using different colours so that physicians can evaluate hotspots more quickly. Because of the gamma camera, the bone scintigraphy images used here were technically poor in terms of resolution, which makes the evaluation of images more difficult. Better results can be achieved using newer camera technologies. Our database was drawn from two hospitals, and a larger experimental group would ensure better accuracy of results. This study can also be expanded by use of the multireader, specified by each type of cancer. New segmentation algorithm for detection of hot spots can be written.
References
- Tang J, Rangayyan RM, Xu J, Naqa I, Yang Y. Computer aided detection and diagnosis of breast cancer with mammography: Recent advances. IEEE Trans InfTechnol Biomed 2009; 13: 236-251.
- Ömür Ö, Kapulu C, Uğur Ö. Nuclear medicine techniques in musculoskeletal disease. J Turk Ass O paedTraumatol2006; 6: 1-2.
- Sadık M. Computer-Assisted diagnosis for the interpretation of bone scintigraphy: A new approach to improve diagnostic accuracy. Institute of Medicine at Sahlgrenska Academy University of Gothenburg, Sweden. 2009.
- Huang J, Kao P, Chen Y. A set of image processing algorithms for computer-aided diagnosis in nuclear medicine whole body bone scan images, IEEE Trans NuclSci 2007; 54: 514-522.
- Ohlsson M, Edenbrandt L, Sjöstrand K, Richter J, Kaboteh R, Sadik M, Suurkula M, Lomsky M, Gjertsson P. Automated decision support for bone scintigraphy. 2009.
- Erdi YE,Humm L, Imbriaco M, Yeung H, Larson SM. Quantitative bone metastases analysis based on image segmentation. JNucl Med 1997; 99: 1401-1406.
- Yin TK, Chiu NT. A computer-aided diagnosis for locating abnormalities in bone scintigraphy by a fuzzy system with a three-step minimization approach, IEEE Trans MedImag 2004; 23: 639-654.
- Sajn L, Kukar M, Kononenko I,Milcinski M. Computerized segmentation of whole-body bone scintigrams and its use in automated diagnostics. Comput Methods Programs Biomed 2005; 80: 47-55.
- Sadik M, Jakobsson D, Olofsson F, Ohlsson M, Suurkula M, Edenbrandt L. A new computer-based decision-support system for the interpretation of bone scans. Nucl Med Commun2006; 27: 417-423.
- Horikoshi H, Kikuchi A, Onoguchi M, Sjöstrand K, Edenbrandt L. Computer-aided diagnosis system for bone scintigrams. Ann Nucl Med2012; 26: 622-626.
- Al-Rifaie M, Aber A. Identifying metastasis in bone scans with stochastic diffusion search. IEEE 2012; 519-523.
- Nakajima K, Nakajima Y, Horikoshi H, Ueno M, Wakabayashi H, Shiga T, Yoshimura M, Ohtake E, Sugawara Y, Matsuyama H, Edenbrandt L. Enhanced diagnostic accuracy for quantitative bone scan using an artificial neural network system: a Japanese multi-center database project.Ejnmmi Res 2013; 26: 83.
- Tokuda O, Harada Y, Ohishi Y, Matsunaga N, Edenbrandt L. Investigation of computer-aided diagnosis system for bone scans:a retrospective analysis in 406 patients, Ann Nucl Med 2014; 28: 329-339.
- Aslantas A, Dandil E, Saglam S, Çakiroglu M. CADBOSS: A computer-aided diagnosis system for whole-body bone scintigraphy scans.J Can Res Ther 2016.
- Rajeshwar D, Priyanka SD.Image segmentation techniques. Int J ElectrCommTechnol 2011; 3:66-70.
- Wang J, Kong J, Lu Y, Qi M, Zhang B. A modified FCM algorithm for MRI brain image segmentation using both local and non-local spatial constrains, Comput Med Imaging Graph 2008; 32: 685-698.
- Christophe G. Computer Vision Applications with C-Fuzzy C-means Clustering. Code pro 2011.
- Patrick RM. A Kohonen self-organizing map approach to addressing a multiple objective, mixed-model JIT sequencing problem. Int J Production Economics 2001; 72: 59-71.
- Sakaena K. Self-organizing map with map reduce. Word press 2010.
- Kohonen T, Honkela T. Kohonen network. Scholarpedia 2007; 2:1568.
- Sheshadri HS, Kandaswamy A. The role of active contour models in biomedical image analysis.AoijArtic 2005; 14.
- Kass M, Witkin A, Terzopoulos D. Snakes: Active contour models, Inter J comp vis 1988; 321-331.
- Li C, Kao C, Gore J, Ding Z. Implicit active contours driven by local binary fitting energy, Computer Vision and Pattern Recognition Conference 2007; 1-7.
- Mumford D, Shah J. Optimal approximations by piecewise smooth functions and associated variational problems. Commun Pure Appl Math 1989; 42: 577-685.
- Chan T, Vese L. Active contours without edges. IEEE Trans ImagProc 2001; 10:266-227.
- Chan T, Vese L. A multiphase level set framework for image segmentation using themumford and shah model. Intl J Comp Vis 2002; 50: 271-293.