ISSN: 0970-938X (Print) | 0976-1683 (Electronic)
Biomedical Research
An International Journal of Medical Sciences
Research Article - Biomedical Research (2017) Volume 28, Issue 2
Assessing the classification performance of the mean platelet volume (MPV) in a cardiovascular risk prediction model
1Department of Statistics, Faculty of Sciences, Ankara University, Turkey
2Department of Biostatistics and Medical Informatics, Faculty of Medicine, Izmir University, Turkey
3Department of Biostatistics, Faculty of Medicine, Ankara University, Turkey
4Department of Cardiology, Faculty of Medicine, Ufuk University, Turkey
- *Corresponding Author:
- Özlem GÜLLÜ, Dr.(PhD)
Department of Statistics, Faculty of Sciences
Ankara University, Ankara, Turkey
E-mail: ozlem.gullu@gmail.com
Accepted date: June 14, 2016
The purpose of this study was to compare the properties of a number of novel and a traditional measure to evaluate the predictive performance of a new marker. For that purpose, we analyzed data, which contains age, gender, hypertension, hyperlipidemia, and smoking and total cholesterol/high density lipoprotein as the clinical risk factors for the initial model, obtained from 293 patients having a risk of coronary artery disease (CAD). Afterwards, the mean platelet volume (MPV) was added to this initial model as a new prognostic marker. The results showed that the addition of MPV improved the model performance; the AUC increased from 0.770 to 0.813 (p=0.011) Then, in order to assess the relative classification power of the MPV to predict CAD events, the data was analyzed by logistic models and risk reclassification indices such as net reclassification improvement index (NRI) and integrated discrimination improvement index (IDI). NRI was found to be 0.103 (p=0.004) and IDI was found to be 0.07 (p=0.003). As a result, the model including the mentioned clinical risk factors and the MPV performed better than that without MPV and also, the ratio of the correctly classified individuals after the addition of MPV increased more than the increase of the AUC.
Keywords
Performance measures, NRI, IDI, Reclassification, Risk assessment.
Introduction
In recent years, prediction models have begun to be used in clinical studies to discriminate between patients with and without disease, in addition to various other diagnostic methods and laboratory tests. In addition to their use in making diagnosis, prediction models are also used for monitoring a disease, making prospective risk predictions using the followup data and deciding on a treatment by classifying patients according to appropriate risk groups (low, medium, high etc.). Logistic Regression and Cox Regression models are the most widely used prediction models in studies involving a binary response variable. These prediction models are particularly used for predicting cardiovascular diseases.
The studies on how to assess the performance of an established prediction model when a new marker is added have become important. The area under the ROC curve (AUC) is used to assess the discriminatory ability of a prediction model [1]. Recent clinical and epidemiological studies discuss that this method has some limitations and is not explanatory enough to evaluate the clinical utility of a newly added marker [2]. Particularly, the ROC curve is stated to be not sensitive enough to the changes in risk predictions [3]. Besides, the AUC remains limited when a specific threshold is used in calculating it. A minor increase in the AUC, especially when a new marker is added to the model, may not be sufficient evidence of clinical usefulness of this marker [4].
Against such problems, Pencina and D’Agostino proposed two new performance measures to be used in assessing the performance of prediction models as an alternative to the AUC method [5]. These are NRI (Net Reclassification Improvement) and IDI (Integrated Discrimination Improvement) indices. NRI is a measure used to calculate the movement among the risk categories of individuals with and without disease; while IDI measures to what extent a model can discriminate between the individuals with and without disease.
This study aims to assess the clinical utility of the marker “Mean Platelet Volume (MPV)”, which has no known effect and sought to be studied, along with the other known markers used in predicting coronary artery disease (CAD) such as age, gender, hypertension, hyperlipidemia, smoking and total serum cholesterol (TK)/high density lipoprotein (HDL) and to determine its effect on the prediction model by using traditional and novel performance measures.
Materials and Methods
In this study, data were collected from a total of 293 people, who admitted to the cardiology clinic with chest pain and performed coronary angiography, at the Cardiology Department of Ufuk University Faculty of Medicine between 2012 and 2013. The variables such as age, gender, hypertension, hyperlipidemia, smoking and TK/HDL were taken as the known clinical factors for CAD and a reference model was developed. An improved model was developed by adding MPV to the model as a new marker in order to assess its effect. The effect of MPV on the performance of the model was measured using the traditional and novel performance measures described in the following section and reclassification improvement offered by the MPV marker was assessed. De-Long test was used to test the significance of the increase in the AUC, and McNemar's test was used to assess the significance of the NRI and IDI indices. The local Ethical Committee at Ufuk University approved the study (project no: 08035). SPSS for Windows 14.01 (License No: 9869264) package program was used for the logistic regression analysis as well as for the measurement of risk factors. R (Version i386 3.1.3) packages of Hmisc (Frank E Harrell Jr, 2015) and Clinfun (Venkatraman E. Seshan, 2015) were used for the calculation and comparison of the performances of the model.
Reclassification Table and NRI
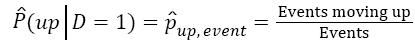
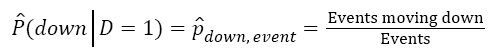
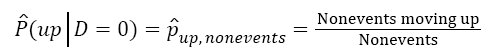
The predicted probabilities based on reference and the improved models are divided into risk categories by using clinically significant threshold values (they are expressed in percentages. For example: <20%-Low Risk, ≥ 20%-High Risk) and a cross tabulation is created. This table is called reclassification table. NRI is a measure that defines the upward and downward movements for the individuals with and without the disease in the risk categories in the reclassification table. Upward movement means reclassification of an individual with the disease into a higher risk category, while downward movement means reclassification of an individual without the disease to a lower risk category [6]. NRI is defined as follows [5]:
NRI=[P(up|D=1)-P(down|D=1)]-[P(up|D=0)-P(down|D=0)]→(1)
D1=Event
D0=Nonevent
 →(2)
→(2)
 →(3)
→(3)
 →(4)
→(4)
 →(5)
→(5)
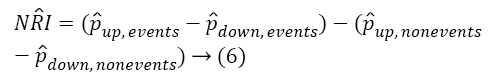
Eq. (6) estimates the NRI,
IDI
IDI is used in cases where the risk categories cannot be clinically known or defined, and it is equivalent to the difference between the mean sensitivity and the mean 1- specificity of the reference and improved models over all threshold values within the range [0-1]. IDI is defined [5].
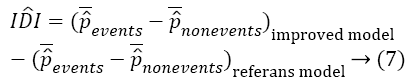
Equation 7 is the difference between the discrimination slopes of the improved and reference models.
CAD is the most common type of heart disease which results in death. Many parameters and tests are used in the diagnosis of this disease. Among the known markers of CAD are gender, age, family history, hypertension, diabetes mellitus, dyslipidemia, smoking, sedentary lifestyle, obesity and personality structure. Homocysteine and C Reactive Protein (CRP) are among the recently defined markers. In addition to these markers, platelet also plays an important role in the pathogenesis of coronary atherosclerotic diseases. The “Mean Platelet Volume (MPV)” is known to increase in acute coronary syndromes [7-9]. In this sense, aim of this study assesses the reclassification improvement of the MPV whose effect has not been known yet.
Findings
Table 1 shows the descriptive statistics of the variables used in the data set.
| Variables | n (%) | |
|---|---|---|
| Nonevents | ≤20 | 157 (53.6) |
| Events | >20 | 136 (46.4) |
| Gender | Male | 155 (52.9) |
| Female | 138 (47.1) | |
| Hypertension (HT) | Yes | 177 (60.4) |
| No | 116 (39.6) | |
| Hyperlipidemia (HL) | Yes | 162 (55.3) |
| No | 131 (44.7) | |
| Smoking | Yes | 106 (36.2) |
| No | 187 (63.8) | |
| Mean±SD (min-max) | ||
| Age | 57.88±9.55 (31-86) | |
| TC/HDL | 4.78±1.56 (1.42-11.91) | |
| MPV | 8.85±1.34 (6.10-13.91) |
Table 1: The proportional distribution of patients according to variable of categories.
Among the risk factors for CAD, gender, age, HT, HL, smoking, TC/HDL ratio and MPV variables were analyzed through logistic regression, and all variables were found to be statistically significant (p<0.05). Reference model and the improved model of estimates of regression coefficients along with their standard errors were given below.
Reference Model: -5.027(1.158)+0.037 Age (0.016)+1.446 Male(0.296)+0.710 HT(0.303)+0.888 HL(0.272)+0.845 smoking (0.304)+0.147 TC/HDL(0.09)
Improved Model: -9.312(1.593)+0.025 Age(0.017)+1.381 Male (0.310)+0.717 HT(0.316)+0.837 HL (0.285)+0.870 Smoking(0.319)+0.182 TC/HDL (0.096)+0.550 MPV(0.118)
Results of the traditional performance Measures
The performances of the reference model and the improved model containing the variable of MPV were evaluated through traditional measures. Table 2 shows the results of the traditional performance measures analysis.
| Performance Measures | Reference Model | Improved Model |
|---|---|---|
| ROC-AUC | 0.770 [ 0.716-0.823 ] | 0.812 [ 0.763-0.861 ] |
| Discrimination Slope | 0.22 | 0.29 |
| NRI | 0.103 | |
| IDI | 0.07 | |
Table 2: The results of the traditional performance measures for the reference and the improved models.
First, the discriminatory ability of each prediction model was calculated using the area under the ROC curve (AUC), and the difference between the values was found to be statistically significant (p=0.011). Table 3 shows the sensitivity, specificity and accuracy of the predicted probabilities according to the threshold value of 0.20, which is frequently used value in the CAD studies at which NRI is found to be significant. According the results, sensitivity, specificity and accuracy values increased in the improved model.
| Prediction Models | Sensitivity (TPR) | Specificity (TNR) | Accuracy |
|---|---|---|---|
| Reference Model | 0.926 | 0.262 | 0.675 |
| Improved Model | 0.941 | 0.35 | 0.744 |
Table 3: The results of ROC analysis of the reference and the improved models ** cut-off 0.20.
Table 4 presents the classification of the probability estimates obtained from the reference and the improved models.
| Risk Category | State | |||
|---|---|---|---|---|
| Reference Model |
No CAD | Yes CAD | Total | |
| Low Risk, <20% | 41 | 10 | 51 | |
| High Risk ≥ 20% | 116 | 126 | 242 | |
| Improved Model | Low Risk <20% | 55 | 8 | 63 |
| High Risk ≥ 20% | 102 | 128 | 230 | |
Table 4: The classification of the probability estimates of the reference and the improved models.
Table 4 shows that adding MPV to the model caused an increase of 1% in the number of high risk individuals diagnosed with CAD and a decrease of 9% in the number of high risk individuals without CAD.
Table 5 shows the changes in the risk categories induced by the MPV variable. The reference model classified 51 individuals into the low risk category and 10 of them were diagnosed with CAD. The improved model, on the other hand, classified 63 individuals into the low risk category and 8 of them were diagnosed with CAD. Besides, out of 242 individuals classified by the reference model as high risk, a total of 126 were diagnosed with CAD. On the other hand, 128 individuals were diagnosed with CAD out of 230 individuals classified by the improved model as high risk.
| Improved Model | |||
|---|---|---|---|
| Reference Model | Low Risk <20% | High Risk ≥20% | Total |
| Low Risk <20% | n=42 | n=9 | n=51 |
| 5 CAD (12%) | 5CAD (55%) | 10 CAD (20%) |
|
| High Risk ≥20% | n=21 | n=221 | n=242 |
| 3CAD (14%) | 123CAD (57%) | 126 CAD (52%) |
|
| Total | n=63 | n=230 | n=293 |
| 8CAD (13%) | 128CAD (56%) | 136 CAD (46%) |
|
Table 5: Reclassification table of the reference and the improved models.
Table 6 shows that the improved model classified 5 individuals with CAD into the high risk category and 5 individuals with CAD into the low risk category. It also classified 4 individuals without CAD into the high risk category and 18 individuals without CAD into the low risk category. According to Equation (6), the net reclassification index (NRI) between the risk categories for the individuals with and without the disease is calculated as 10.3% (p=0.004).
| Improved Model | ||||
|---|---|---|---|---|
| Crosstab for events |
Reference Model | <20% | ≥20% | Total |
| <20% | 5 | 5 | 10 | |
| ≥ 20% | 3 | 123 | 126 | |
| Total | 8 | 128 | 136 | |
| Improved Model | ||||
| Crosstab for nonevents | Reference Model | <20% | ≥20% | Total |
| < 20% | 37 | 4 | 41 | |
| ≥ 20% | 18 | 98 | 116 | |
| Total | 55 | 102 | 157 | |
Table 6: The classification table of the patients with and without CAD.
According to Equation (8), IDI is calculated as 7% (p=0.003). The difference between the mean predicted probabilities of individuals with and without CAD increased by 7% with the addition of MPV.
Discussion and Conclusion
Classification of patients according to risk categories is important to decide on the treatment. If a model is to be used in clinical decision-making, it should be analyzed and assessed using the new performance measures specified in this study along with the AUC [10].
The medical literature shows that there are many studies conducted in recent years on the use of newly proposed performance measures in assessing the performances of prediction models, and especially in assessing the clinical utility of a new marker added to a model [3,5,10-14]. For example, Ridker et al. developed a reference model including the known clinical risk factors for CVD prediction in women and obtained an improved model by adding the markers of "family history" and "CRP". With the new markers added, the AUC slightly increased from 0.805 to 0.808. The change in the risk categories was assessed using reclassification tables and it was found that 30% of the women initially diagnosed with the disease were reclassified into a higher risk category [15]. Pencina et al. added the variable HDL (High-density lipoprotein) to the basic model they developed for analyzing the risk factors that affect the CAD, and they assessed the effect of this variable on the model by using the NRI. With the HDL added to the model, the AUC slightly increased from 0.762 to 0.774. The difference between the AUC values was not found to be statistically significant (p=0.092). However, according to the results of the NRI, the probability of the individuals with CAD to be reclassified into a higher category is 12% more than that of those without CAD.
In this study, we examined the effect of the MPV on the performance of a model in predicting CAD by using both traditional and newly proposed measures. With the addition of the MPV to the model which already includes such risk factors as age, gender, hypertension, hyperlipidemia, smoking and TC/ HDL, the AUC increased from 0.770 to 0.812. Detailed examination of the changes in the risk categories made by using the reclassification tables show that the improved model with the MPV decreased the probability for the presence of CAD in individuals without the disease from 20% to 13%. In other words, the prediction model’s percentage of error was reduced. From another perspective, the improved model increased the probability for the presence of CAD in individuals with the disease from 52% to 56%, thus also increasing the prediction model's percentage of accurate classification. Such a change in the risk categories NRI was calculated as 10.3%. Therefore, when the MPV is added to the model, the probability of the individuals with CAD to be reclassified into a higher category is 10.3% more than that of those without CAD. In this sense, the improved model including both the clinical risk factors and the MPV can be said to have better performance as compared to the reference model. MPV is a risk factor that has the ability to discriminate the CAD. Thus, MPV can be said to be a simple, easy to use, cost-effective and importance marker that can be used in CAD prediction.
In this study aiming to assess the performance of a new marker, the slight increase in the AUC induced by the new marker was found to be able to cause much better improvement when assessed with the new performance measures. The MPV marker added to the model increased the discriminative ability of the model by 4% as compared to the AUC. The analysis with the NRI shows that the discriminative ability of the model is 10.3% better when the MPV is added. The NRI estimates the effect of MPV a lot more sensitively than the AUC. As a result, we found that the newly developed performance measures (NRI and IDI) produced more precise results than the traditional approach (AUC). In the literature, AUC is a method widely used in measuring the classification accuracy of prediction models. However, this study points out that, in addition to the AUC, NRI and IDI should also be taken into account, especially in determining whether to incorporate into a model a new marker whose effect is sought to be examined. In this sense, this study will help increasing the accuracy of analyses and avoiding wasting time and resources along testing attempts as well as providing a basis for future studies.
Acknowledgement
The study was presented as a poster presentation as follows identifier: Güllü Ö, Ates C, Tekindal MA, Doğanay EB, Yavuz Y, Gurcan IS, Ekici B. Evaluating the Improvement Of Model Performance with The Addition of Mean Platelet Volume Marker in A Cardiovascular Risk Prediction Model. The 8th Conference of Eastern Mediterranean Region of International Biometric Society 11-15 May 2015, Cappadocia, Nevsehir, Turkey.
References
- Cook NR. Use and Misuse of the Receiver Operating Characteristic Curve in Risk Prediction, 2007; JAHA.
- Cui J. Overview of Risk Prediction Models in Cardiovascular Disease Research, Ann Epidemiol 2009; 19:711-717.
- Cook NR, Paynter NP. Performance of reclassification statistics in comparing risk prediction models, Biom J 2011; 53: 237-258.
- SteyerbergEW, Pencina MJ, Lingsma HF. Assessing the incremental value of diagnostic and prognostic markers: a review and illustration. EJCİ 2012.
- PencinaMJ, D’Agostino RB, D’AgostinoRB. Evaluating the added predictive ability of a new marker: From area under the ROC curve to reclassification and beyond, Statis Med 2008; 27:157-172.
- Gu W, Pepe MS. Measures to Summarize and Compare the Predictive Capacity of Markers, UW Biostatistics Working Paper Series University of Washington 2009; 342.
- KeskinS, Gürler M, TemelogluE. OrtalamaTrombositHacmininKoronerArterHastalığı Risk Faktörleriyleilişkisi. TurkiyeKlinikleri J Med Sci 2006; 26:380-384.
- Ekici B, Erkan AF, Alhan A. Is mean platelet volume associated with the angiographic severity of coronary artery disease.Kardiol Pol 2013; 71: 832-838.
- Massberg S, Schulz C, Gawaz M. Role of platelets in the pathophysiology of acute coronary syndrome. SeminVasc Med2003; 3: 147-162.
- Steyerberg EW, Vickers AJ, Cook NR. Assessing the performance of prediction models: a framework for traditional and novel measures. Epidemiology (Cambridge, Mass.) 2010; 21: 128-138.
- Cook NR. Statistical evaluation of prognostic versus diagnostic models: beyond the ROC curve. Clinical Chemistry 2008; 54: 1.
- Cook NR, Buring JE, Ridker PM. The Effect of Including C-Reactive Protein in Cardiovascular Risk Prediction Models for Women, Ann Intern Med2006; 145:21-29.
- Kerr KF, McclellandRL, Brown ER, Lumley T. Evaluating the Incremental Value of New Biomarkers with Integrated Discrimination Improvement. Am J Epidemiol 2011; 174: 364-374.
- Ridker PM, Buring JE, Rifai N, Cook N. Development and validation of improved algorithms for the assessment of global cardiovascular risk in women. JAMA2007; 297:611-619.
- Cook NR, RidkerPM. The Use and Magnitude of Reclassification Measures for Individual Predictors of Global Cardiovascular Risk. Ann Intern Med 2009; 150: 795-802.