ISSN: 0970-938X (Print) | 0976-1683 (Electronic)
Biomedical Research
An International Journal of Medical Sciences
Research Article - Biomedical Research (2017) Volume 28, Issue 1
Approach for design of early warning monitoring system for detection of the abnormal cardiac behaviour of any individual
1Department of Electronics & Telecommunication, Shri Shankaracharaya College of Engineering and Technology, India
2Chhattisgarh Swami Vivekananda Technical University, Bhilai, India
- *Corresponding Author:
- Chinmay Chandrakar
Department of Electronics and Telecommunication
Shri Shankaracharaya college of Engineering and Technology
India
Accepted date: April 12, 2016
In Electrocardiogram (ECG) the heart beat feature QRS is very important parameter for analysis. This feature is the basis for analysis in any heart beat classification automated diagnosis system. In this paper the method which we have used is by using the counter which is used in parallel. The first level is detection of heart beats in two steps which involved hashing. Then in our second level we designed profiler, which profiles the person regular and irregular ECG characteristic behaviour. Our proposed method depends on series of data which is of ECG instead of number of information contained in the ECG signal. Because of parallel processing the data storage unit requirement as well as the processing time is less. The dependent values in the proposed method changes according to the change in the ECG waveform. Such type of analysis method is very suitable for detection of heart disease (e.g., arrhythmia) purposes. Most significant application of such characteristic plotting is to generate an alert signal for irregular ECG behaviour of any person. Such automated system will be very useful for remote areas where human operator monitoring (Cardiologist) is not available and is extremely costly.
Keywords
Electrocardiograms signal, Indexing, Gaussian curve, Data storage units, Parallel processing.
Introduction
Particularly, the determination and separation of QRS waveform between regular and irregular waveforms are very important clinical criteria for diagnosing of patients. Over the last decades there have been a techniques proposed to determine these waveforms. For instance early attempts of Senhadji et al. compared the performance of three different wavelets to determine the beats which are hidden in the waveform [1]. Sahambi et al. proposed method for ECG waveform separation by using derivative of lower order in which he was used Gaussian function [2]. Many more methods have been proposed which are concentrated on spectral [3,4] or wavelet features [5,6], related with superimposed features [7,8] and spatial context [9,10] to differentiate the heart beats signal [11-16]. The author of the University of Wisconsin was first to proposed the method of determination of heart beat in real time in processor [11]. Ning et al. proposed the location of the true peak can be determined according to the fact that the true peak has the largest magnitude within its 200 ms time window [17]. Jain et al. Proposed, the ECG Feature Extractor provided by Lab VIEW Biomedical toolkit detects QRS waves [18]. Yazdani et al. proposed that for QRS determination valley points before and after R-wave are sufficient [19]. Nallathambi et al. proposed, the pre-processed ECG signal is converted into a train of pulses using the IF sampler [20]. Once the process of beat determination has complete, the correct beat discrimination process of heart beats take place. Methods such as detection of any symbol, repeated pattern which is going to repeat, network based on neurons, and vector machines have maximum suggested for heart beat discrimination [21,22]. Learning methods based on training data from the sample which result in new mapping based on information which was processed was discussed by author in the paper [23]. De Chazal et al. discriminate the beats by studying the distance between the two R-peaks, ECG waveform [24]. Christov et al. proposed comparison of ECG features for beat classification in time and frequency domain [25]. Haseena et al. [26] uses a combination of neuron and fuzzy for discrimination of heart beats. Fayn et al. problem related with myocardia and ischemia are discussed in [27,28] where signal characteristic are plotted in time plane. Can et al. In this paper author has proposed the use of statistical and dynamic features for classification of heart beats. These two features are combined for the classification result [29]. Banerjee et al. The author of the paper has discussed the analysis and classification of the ECG signal by using cross wavelet transform. The significance of this proposed method is that it uses the spectral difference as cross correlation gives the similarity between the two waveforms [30]. Kiranyaz et al. The fusion of feature and classification was suggested by author in this paper by performing neural network of 1D convolution to increase the efficiency of classification algorithm [31]. We used data from the MIT-BIH arrhythmia database to test the efficiency of our technique [32]. All ECG data used here are sampled at 360 Hz, and the resolution of each sample is 8 bits/sample, therefore the bit rate of these data is 2880 bps. The proposed method was run for both regular and irregular heartbeats.
Materials and Methods
Pre-processing of ECG signal
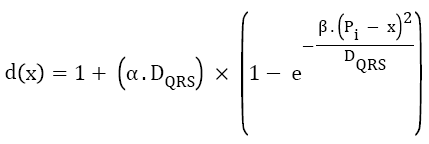
High frequency noise has been removed by using the simple time constant equation in which window is moved from one Rpeak to the next R-peak and the low frequency noise has been removed by using the frequency domain transformation. By knowing the QRS complex duration and the position of Rpeak as mentioned below, a window is considered. Equation (1) determines the length of this window, defined as function of QRS complex wave duration (DQRS), and location of every detected Rpeak [26].
 →(1)
→(1)
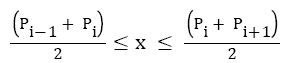
Where, α and β are constant parameters, Pi is the sample index of ith detected Rpeak, and x is the sample index, which varies through.
Where
Q-R duration=Time of Rpeak -Time of QRSonset
R-S duration=Time of QRSoffset -Time of Rpeak
QRS duration (DQRS) =Time of QRSoffset -Time of QRSonset
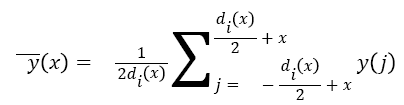
Parameter α determines maximum denoising window length while β determines window’s growth rate around the detected Rpeak. To remove noises, denoising window slides through the noisy signal and the value of the signal at the centre of the window is set to the mean value throughout the window. Equation (2) represents an ECG signal as a discrete function y (x), where x denotes sample index, then the consequent denoised signal y (x), at xth sample index is obtained as follows:
 →(2)
→(2)
QRS beat detection and profiling system
Our proposed method depends more on series of data of ECG waveform rather than any specific feature of ECG waveform. The basic concept is to partition the input ECG signals into series of 0-1 string. For this, analog to digital conversion was performed. The final output was the binary data stream corresponding to ECG waveform. These data stream was now used for further processing. Next step was to select a string of L bytes. The start and end limit of this binary information are selected so that when long binary string are repeated that should lie on the same start and end limit. To obtain this start and end limit are selected based on R-peak. Between these two repeated start and end points the minimum value of binary data bits Q and S points starting from middle R-peak to the left and right are determine for repeated occurrence within a fixed time duration. Hereafter the data bits between Q point and S point will be called as signature which is W bytes. L is varying as it depends on the start and end points of R-peak, which basically works on R-R interval. Similarly W is not fixed because it depends on Q point and S point locations. To obtain the process to work in real time QRS detection and classification, we use the storage elements which are arrange in parallel. Number of times counting has been avoided by arranging storage elements in parallel; string was hashed to a certain value. In our method the two steps of hashing has been done in two phases. The Phase 1 hash has been first generated by the string. This hash value is used as the Now onward as a signature this hash value is used for processing. The ‘m’ independent hash value which has to be indexed into ‘m’ arrays has been developed by this signature. Considering the storage element of width to be ‘n’, than the depth of each ‘m’ hash memory would have 2n locations. Each indexed array location is incremented. During process parallel counters are used. Out of ‘m’ counters say ‘k’ crosses the threshold THR value, the signature is detected as a QRS waveform. Than cardiac profile is plotted against the time duration of the suspected QRS waveform (In form of number of samples) and the number of count the suspected QRS waveform has repeated.
Architecture
Phase 1: In Phase 1, we assumed the width of sliding window to be one R-R interval as shown in Figure 1. It means, every consecutive two R-R interval blocks in the packet stream is processed. Therefore, size of the string between two boundaries (in bytes) in the first phase is the data stream between two consecutive R-R intervals. On every cycle of clock, one R-R interval string is shifted and a new byte for the packet stream of two consecutive R-R intervals was taken to form a next packet stream i.e. boundaries (in bytes).Now from this packet stream we search for the second consecutive eight ones (binary) which is actually R-peak. With reference to this R-peak we go on finding Q point and S point to the left and right side respectively. Between these two consecutive boundaries the minimum value of binary data bits starting from middle R-peak to the left and right are determine for frequent occurrence within a fixed time duration. This minimum value is taken as Q and S point. Now the binary stream found between this detected Q and S point, we declare that portion of the stream as a boundary of detected signature and can act as a hash value in phase 1. These L bytes gives the hash value using an eight bit comparator .We use the binary stream between Q point and S point as a signature of W bytes as the final result of phase 1. Boundary of the next signature is considered to be part of the next L byte. Output of the string in phase 1 results from L-bytes hashing to W -bits. Figure 1, shows the function blocks of phase 1.

Figure 1: System design concept for Phase 1 and 2 [33].
Phase 2: In Phase 2, we use the phase 1 hash value (final signature of phase 1) to generate the hash value which is of size m as shown in Figure 1. We use these hash values as memory indices in phase 2. Similar to phase 1, the hash functions were designed. The array ‘i’ has been indexed by the hash value. The hit location is incremented hence the 2n locations also function as counters. Figure 1 shows the working flow of phase 2. The counters (black locations in Figure 1) will be incremented. After calculating final result for phase 1, which is binary stream between Q point and S point as a signature of W bytes, the ‘m’ independent hash value for phase 2 has been determined. The number of samples between Q point and S point of first R-peak has been calculated. This total number of sample will act as an independent hash value i.e. ‘m’. This process is repeated for all the determined R-peak. Because of varying characteristic of ECG there is a changes in QRS waveform (duration and amplitude), and therefore in the hence the number of discrete values as shown in Table 1. This different number of sample will act as an independent hash value in phase 2 i.e. ‘m’. Once the hash value has been found for phase 2, then for the respective hash value of the entire signature, the binary addition was performed for the entire sample found between Q point and S point. This addition was used to index into array ‘i’. The resultant value acts as a memory address ‘n’ for the array ‘i’. Therefore when hit location is incremented, the array locations also function as a counter.
| Sr. No. | R-peak Time | MIT BIH R-peak Sample Index | R-peak index calculated | R-R interval | QRS Duration (No of Samples) |
Sum of Q-S Array |
| 1 | 0 | 21 | 0 | 0.736111 | 20 | 3584 |
| 2 | 0.736111 | 265 | 265 | 0.863889 | 18 | 3446 |
| 3 | 1.6 | 575 | 576 | 0.836111 | 19 | 3567 |
| 4 | 2.436111 | 876 | 877 | 0.844444 | 18 | 3411 |
| 5 | 3.280556 | 1180 | 1181 | 0.836111 | 18 | 3688 |
| 6 | 4.11667 | 1482 | 1482 | 0.897212 | 18 | 3516 |
| 7 | 5.013887 | 1795 | 1802 | 0.897111 | 20 | 3942 |
| 8 | 5.911111 | 2127 | 2128 | 0.897333 | 18 | 3379 |
| 9 | 6.788889 | 2444 | 2444 | 0.836111 | 20 | 3664 |
| 10 | 7.625 | 2744 | 2745 | 0.830556 | 19 | 3599 |
| 11 | 8.455556 | 3044 | 3044 | 0.841667 | 20 | 3767 |
| 12 | 9.297222 | 3347 | 3347 | 0.833333 | 20 | 3963 |
| 13 | 10.13056 | 3647 | 3647 | 0.883315 | 22 | 4161 |
Table 1: Result of QRS detection system when tested on MIT-BIH arrhythmia dataset 103 (10 sec Long) in our algorithm.
If any counting unit crosses the fixed limit, the binary series is consider as a worm i.e. QRS waveform. System setting is discussed as follows:
• L ≈ 288-432: L is a notation and it depends on the start and end limit. Size of the binary values between two start and end (in bytes) in the first phase which depends on two consecutive R-R intervals.
• W ≈ 12-28: W is notation of the position of Q point and S point.
• l=8: Is in bits to check the limit in the first phase of hashing.
• M ≈ 12-21: size of second phase of hashing.
• N ≥ 12: The binary addition of the entire sample found between Q point and S point in number of bits.
• K: limit of counting unit to reach the fixed value
• THR: limit of counter value to reach
Based on the contents of the counters as shown in Table 2, a Gaussian curve is obtained, where irregularity lie on the end of the curve and was also discussed by one of the author in his paper [34].
| Sr. No. | Data Sets | |||||
| 232 | 100 | 200 | ||||
| No. of Samples between Q & S points | Counts of sample | No. of Samples between Q &Spoints | Counts of sample | No. of Samples between Q&S points | Counts of sample | |
| 1 | 8 | 4 | 4 | 1 | 4 | 2 |
| 2 | 9 | 1 | 5 | 1 | 7 | 2 |
| 3 | 10 | 5 | 6 | 1 | 8 | 1 |
| 4 | 11 | 13 | 7 | 1 | 9 | 8 |
| 5 | 12 | 11 | 8 | 6 | 10 | 11 |
| 6 | 13 | 15 | 9 | 3 | 11 | 13 |
| 7 | 14 | 8 | 10 | 4 | 12 | 11 |
| 8 | 15 | 22 | 11 | 3 | 13 | 14 |
| 9 | 16 | 10 | 12 | 2 | 14 | 10 |
Table 2: Storage unit content for profiling when tested on MIT-BIH arrhythmia database (15 min. long each).
Simulation result
Performance evaluation of beat detection and profiling system
We run our algorithm for data of first fifteen minutes of MITBIH database. Irregular beats gets generated at the end of the curve. Figure 2 shows how the content of the counter get distributed for datasets 103, 100, 200 and 232, respectively. Gaussian curve formed from the content of the counter i.e. count value in the x-axis and number of times that count value has repeated has plotted in the y-axis as shown in the Figure 2. Any value which is not zero and is lying after the Gaussian curve represent the irregular beats. To cross check our result we calculated the area under the curve which was laying outside the Gaussian curve and the results are shown in Table 3. The Equation 3 gives the area under the curve for abnormal regions.

Figure 2: Distribution of counter contents for MIT-BIH arrhythmia database readings.
| Data Set | MIT-BIH Abnormal(%) | Total No. count of samples | 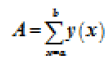 |
Our Abnormal (%) |
Error % |
| 103 | 0 | 1046 | 0 | 0 | 0 |
| 100 | 0.675 | 1138 | 7 | 0.615 | 0.06 |
| 200 | 19.34 | 1413 | 287 | 20.31 | 0.97 |
| 232 | 15.79 | 949 | 148 | 15.59 | 0.20 |
| 105 | 2.09 | 1305 | 12 | 0.919 | 1.17 |
| 112 | 0 | 1260 | 0 | 0 | 0 |
| Avg. | 6.3158 | 6.239 | 0.07 |
Table 3: Result of area of the curve laying outside the Gaussian curve when tested on MIT-BIH arrhythmia database (fifteen min. long each).
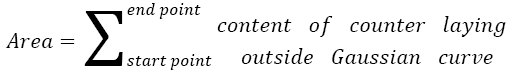 →(3)
→(3)
Table 3 shows the performance of our algorithm (regular and irregular beats). For example, point (16,309) in Figure 2 (b) corresponds to the hash value of 16 as the ECG features (Number of samples between Q and S points) of particular beat. The memory location required is 309. So our result states that which beats are regular and which beats are irregular in the Gaussian curve. Various earlier proposed methods have been compared with our proposed method to evaluate the abnormality configurations and have been shown in Table 4. Performance has been compared with total abnormality detection accuracy (TCA/DER), and is defined in the Equation 4.
| Ref. | Algorithm | Se% | Sp% | No. of Features |
| [24] | De Chazal | 77.7 | 98.8 | 15 |
| [25] | Christov et al. | 94.77 | 99.08 | 15 |
| [22] | Besrour et al. | 98.38 | 94.87 | 15-Oct |
| [26] | Haseena et al. | DER=97.54 | 6 | |
| [28] | Fayn J | DER=96.9 | 15-Oct | |
| [29] | Can et al. | DER=99.32 | 3 | |
| [30] | Banerjee et al. | DER=97.6 | 6-Apr | |
| [31] | Kiranyaz S et al. | DER=98.3 | 15-Oct | |
| [34] | Chang et al. | DER=82.5 | 15-Oct | |
| Proposed algorithm | - | DER=98.78 | 1 | |
Table 4: Comparison of abnormality detection approaches on signal from MIT-BIH arrhythmia database.
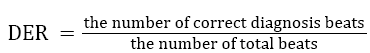 →(4)
→(4)
Significance of proposed method
1. Most significant application of such characteristic plotting is to generate an alert signal for irregular ECG behaviour of any person irrespective of their physical condition.
2. Our proposed automated system will be especially very useful for diagnosis of heart patients of remote areas where human operator monitoring (Cardiologist) is not available and is extremely costly.
3. Our approach demonstrates regular and irregular beats in an ECG waveform based on profile curve, that’s why it is independent of gender (male or female) and age (young or old), physical condition (walking or running, sleeping or sitting) as compared to other approaches which work on fixed statistical parameters of ECG waveform for which a person in a relaxed condition is needed.
4. This type of binary data stream processing is independent of any fixed value of specific features.
5. Our structure requires only simple digital devices e.g. comparator, counters.
Conclusion
We proposed a technique for detecting regular and irregular beats for any individual. Our technique relies more on the data stream corresponding to ECG beats than any particular feature therefore any changes in the parameter on QRS waveform (amplitude and time) all comes under consideration as compared to conventional classification system. The output of our method results in a Gaussian curve for particular person, indicating the presence of irregular beats. Most important characteristic of our method for detection of regular and irregular beats is that it is independent of gender (male or female) and age (young or old) because it processes by taking sequence of binary data as an information instead of any fixed value of the ECG waveform. Our proposed method can be used as alerting system as it detects the presence of irregularity of heart beats in the ECG waveform. Such automated system will be very useful for remote areas where human operator monitoring (Cardiologist) is not available and also for those who will not able to afford expensive cardiac treatment.
References
- Senhadji L, Carrault G. Comparing wavelet transforms for recognizing cardiac patterns. IEEE Eng Med Biol 1995; 14:167-173.
- Sahambi JS, Tandon SM, Bhatt RKP. Using wavelet transforms for ECG characterization: an on-line digital signal processing system. IEEE Eng Med Biol 1997; 16: 77-83.
- Hamilton PS, Tompkins WJ. Quantitative investigation of QRS detection rules using the MIT-BIH arrhythmia database. IEEE Trans Biomed Eng 1986; 33: 1157-1165.
- Thakor NV, Webster JG, Tompkins WJ. Estimation of QRS complex power spectra for design of a QRS filter. IEEE Trans Biomed Eng1986; 31: 702-706.
- Li C, Zheng C, Tai C. Detection of ECG characteristic points using wavelet transforms. IEEE Trans Biomed Eng1995; 42:21-28.
- Castro Kogan D, Geva AB. ECG feature extraction using optimal mother wavelet. IEEE EMBE IntConf2000; 346-350.
- Romero I, Serrano L, Ayesta. ECG frequency domain features extraction: A new characteristic for arrhythmias classification.Conf IEEE Eng Med Boil Soc2001; 2: 2006-2008.
- Kadambe S, Murray R, Boudreaux-Bartels GF. Wavelet transform based QRS complex detector. IEEE Trans Biomed Eng 1999; 46:838-848.
- Romero L, Addison PS, Grubb NR. Wave detection using continuous wavelet modulus maxima. IEEE Proc Comp Cardiol2003; 30:565-568.
- Tkacz EJ, KomorowskiD. An improved statistical approach to the QRS detection problem using matched filter facilities. Biomed Technik/Biomed Eng1992; 37:99-109.
- Pan J, Tompkins WJ. A real-time QRS detection algorithm. IEEE Trans Biomed Eng1885; 32:230-236.
- Dotsinsky IA,Stoyanov TV. Ventricular beat detection in single channel electrocardiograms. Bio Med Eng Online2004; 3:3.
- Zhang F, Tan J, Lian Y. An effective QRS detection algorithm for wearable ECG in body area network. Proc IEEE Biomed Circuits SystConf2007; 195-199.
- Iliev I,Krasteva V,Tabakov S. Real-time detection of pathological cardiac events in the electrocardiogram. PhysiolMeas2007; 28:259-276.
- Zhou HY,Hou KM. Embedded real-time QRS detection algorithm for pervasive cardiac care system. Proc 9th IEEE IntConf Signal Process 2008; 2150-2153.
- Cvikl M, Zemva A. FPGA-oriented HW/SW implementation of ECG beat detection and classification algorithm. Digital Signal Process 2010; 20:238-248.
- Ning X, Selesnick IW. ECG Enhancement and QRS Detection Based on Sparse Derivatives. Biomed Sig ProcCont2013; 8:713- 723.
- Jain S, Kumar P, Subashini MM. LABVIEW based expert system for Detection of heart abnormalities. International conference on advances in Electrical Engineering (ICAEE) 2014; 1-5.
- Yazdani S, Vesin JM. Adaptive mathematical morphology for QRS fiducial points detection in the ECG. Computing in Cardiology2014; 38:725−728.
- Nallathambi G, Principe JC. Integrate and Fire Pulse Train Automaton for QRS detection. IEEE Transactions on Biomedical Engineering 2014; 61:317-326.
- Song MH, Lee J, Cho SP, Lee KJ, Yoo SK. Support vector machine based arrhythmia classification using reduced features. Int J Control AutomSyst2005;3:571-579.
- Besrour R, Lachiri Z, Ellouze N. ECG beat classifier using support vector machine. Proc 3rd IEEE IntConfInfCommunTechnol from theory Appl2008; 1-5.
- Hu YH, Palreddy S, Tompkins WT. A patient adaptive ECG beat classifier using a mixture of experts approach. IEEE Trans Biomed Eng1997; 44:891-900.
- De Chazal P, Dwyer M, Reilly RB. Automatic classification of heartbeats using ECG morphology and heartbeat interval features. IEEE Trans Biomed Eng2004; 51:1196-1206.
- Christov I, Omez-Herrero G, Krasteva V, Jekova I, Gotchev A,Egiazarian K. Comparative study of morphological and time-frequency ECG descriptors for heartbeat classification. Med EngPhys2006; 28:876-887.
- Haseena HH, Mathew AT, Paul JK. Fuzzy clustered probabilistic and multi layered feed forward neural networks for electrocardiogram arrhythmia classification. J Med Syst2009; 35: 1-10.
- Chandrakar C, Sharma M. A real time approach for ECG signal denoising and smoothing using adaptive window technique. IEEE 9th International Conference on Industrial and Information Systems (ICIIS) 2014; 1-6.
- Fayn JA. Classification tree approach for cardiac ischemia detection using spatiotemporal information from three standards ECG leads. IEEE Trans Biomed Eng 2011; 58:95-102.
- Can Y, Vijaya Kumar B, Coimbra MT.Heartbeat Classification Using Morphological and Dynamic Features of ECG Signals. IEEE Transactions on Biomedical Engineering2012; 59:2930-2941.
- Banerjee S, Mitra M. Application of Cross Wavelet Transform for ECG Pattern Analysis and Classification. IEEE Trans InstrMeas 2014; 63: 326-333.
- Kiranyaz S, Ince T,Gabbouj M. Real-Time Patient-Specific ECG Classification by 1-D Convolution Neural Networks. IEEE Transactions on Biomedical Engineering 2016; 63:664-675.
- MIT-BIH (http://www.physionet.org).
- Chang PC, Lin JJ, Hsieh C, Weng J. Myocardial infarction classification using multi-lead ECG using hidden Markov models and Gaussian mixture models. Appl Soft Comput 2012; 12: 3165-3175.
- Faezipour M, Nourani M, Panigrahy R. A real-time worm outbreak detection system using shared counters.Proc 15th Annu IEEE Symp High Perform Interconnects 2007; 65–72.