ISSN: 0970-938X (Print) | 0976-1683 (Electronic)
Biomedical Research
An International Journal of Medical Sciences
Research Article - Biomedical Research (2017) Volume 28, Issue 12
An improved CAD system for abnormal mammogram image classification using SVM with linear kernel
In recent years, breast cancer is a life threatening disease among women. A lot of research had been carried out in the detection and classification of mammogram images to support the physicians. A detailed classification of abnormal mammogram images using support vector machine along with linear kernel is proposed in this paper. The test mammogram images were denoised using Oriented Rician Noise Reduction Anisotropic Diffusion (ORNRAD) filter. The denoised images were segmented by adopting K-means clustering algorithm. Gray-tone Spatial Dependence Matrix (GSDM) and Tamura method is adopted to extract the texture and Tamura features from the segmented image. Genetic algorithm along with Joint entropy is used to select the relevant features. The classification of abnormality was achieved using Support Vector Machine (SVM) along with linear kernel which gives a global classification accuracy of 98.1% is obtained using support vector machine with linear kernel.
Keywords
ORNRAD filter, K-means, Tamura, SVM classifier, Mammogram, GSDM.
Introduction
In recent years, breast cancer is found as one of the major diseases leading to death of human beings especially in woman. Mammogram is widely used by most of the physicians to identify the breast cancer in the present days. Mammography is characterized by low radiation dose and it is the best imaging technique recognized for breast cancer screening as it follows radiologists to execute both diagnostic examinations and screening. Many multi resolution techniques have been employed to process the mammograms to detect the clustered micro-calcifications. Many researchers reported various techniques for identification of tumor region.
The performance of various filters like wiener filter, adaptive median filter and average or mean filter were examined by Ramani et al. [1]. A soft threshold multi resolution technique based on local variance estimation for image denoising was proposed by Patil and Singhai [2]. This adaptive technique effectively reduces the image noise and preserves edges. 2D fast discrete Curvelet transform (2D-FDCT) outperformed in wavelet based image denoising. Peak Signal-to-Noise Ratio (PSNR) using 2D-FDCT is doubled and it also preserves features at boundary of an image.
Manas et al. [3] had a study on denoising of mammogram images based on role of thresholding techniques in wavelet and curvelet transforms. They made a comprehensive study about the effect of various thresholding techniques with the transforms. The subjected mammogram images were supplemented with various noises. It is denoised by the wavelet and curvelet transforms with three thresholding techniques namely soft, hard and block thresholding techniques.
Valarmathi et al. [4] proposed a tumor prediction method which is based on extracting features from mammogram using Gabor filter with discrete cosine transform. The features are classified using neural network. Ezhilarasu et al. [5] used Gabor filter with Wash transform to extract micro calcification features from mammograms. The mammograms are classified using a genetic based SVM model that can automatically determine the optimal parameters C and Gamma of SVM with the highest predictive accuracy and generalization ability.
A hybrid algorithm was proposed by Vanitha and Ramani [6] for the classification of mammogram images. Symlet wavelet and singular value decomposition were used for feature extraction. Artificial bee colony algorithm was combined with Ada Boost algorithm for effective classification. An enhanced neural network based breast cancer diagnosis was proposed by Thein and Tun [7]. The island based training method was used for better accuracy of classification and differential evolution algorithm was used to determine the optimal value for artificial neural network parameters.
A study on morphological and textural features for classifying breast lesion from ultrasound images was proposed by Saranya and Samundeeswari [8]. They had analysed and investigated 33 quantitative morphological features and 38 textural features for the prediction of breast cancer. Mohamed Meselhy et al. [9] proposed a breast cancer diagnosis system based on multiscale curvelet transform. The test mammogram images were decomposed using curvelet transform as a multilevel decomposition and a special set of the biggest coefficients was extracted as feature vector. A Euclidean distance based supervised classifier was used for classification.
Breast cancer mass detection in mammograms using k-means and fuzzy c-means clustering was proposed by Nalini and Ambarish [10]. Threshold, edge based and watershed algorithms were used for segmentation. Rajesh and Ellappan [11] proposed a classification system using wave atom transform and SVM classifier. The features were extracted using WAT algorithm.
Abnormal Mammogram Classification Using SVM
The general flow diagram for the proposed work had been shown in Figure 1. The mammogram breast image under testing undergoes various processes such as preprocessing, feature extraction, feature selection and classification.

Figure 1: Proposed flow diagram for classification of abnormality.
The preprocessing starts with denoising which can be accomplished by ORNRAD filter. ORNRAD is based on linear minimum mean square error and Speckle Reducing Anisotropic Diffusion (SRAD) for Rician distributed noise. ORNRAD filter removes noise in the square intensity image without smoothing out interesting feature of the image. Segmentation is a vital procedure in mammogram picture arrangement in which the testing region is extracted from the entire picture. Here it is done by embracing K-Means clustering algorithm. The K-means algorithm is one of the simplest non-supervised learning algorithm classes which solve the clustering segmentation problems. The initial pixel or region that belongs to one object of interest is chosen first, followed by an interactive process of neighbourhoods’ analysis, which decides whether each neighbouring pixel belongs or not to the same object.
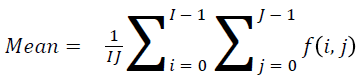
The features present in the image were extracted for the indexing and retrieval of useful information. The texture based features were extracted using GSDM and Tamura method. Tamura features of a pre-processed image can be retrieved through constructing a co-occurrence matrix named Gray Level Co-occurrence Matrix (GLCM) also known as GSDM. In this paper the texture and Tamura features were extracted, which help us in predicting the risk level of the tumor. Each feature value is computed from the matrix constructed using their corresponding formulas and they are used to analyse different properties of an image separately. These features explain the spatial ordering of texture constituents.
Mean
The mean value can be found using
 →(1)
→(1)
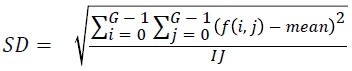
Standard deviation
Standard deviation is found out using the equation
 →(2)
→(2)
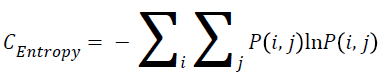
Entropy
The entropy can be measured using the Equation 3.
 →(3)
→(3)
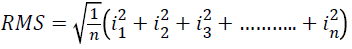
Quadratic mean or RMS
Arithmetic mean of the squares of a set of values can be calculated as
 →(4)
→(4)
Variance
The variance is high for the element whose values differ greatly from the P (i, j)’s average value. It can be computed as
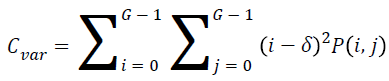 →(5)
→(5)
Smoothness
It is quantified by measuring the difference between length of radial line and the mean length of the lines surrounding it.
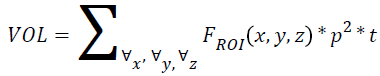
Volume
If p is the pixel size, t is the thickness and r is the individual radial length, then
 →(6)
→(6)
Where FROI is the pixels in region of interest
Breadth
It is the distance from side to side of the tumor region.
Dimension
It is the measurement of the physical space of tumor in terms of width, depth and perimeter.
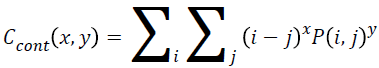
Contrast
Local variance present in the breast cancer mammogram can be measured using contrast. The contrast will be high if P (i, j) values in the matrix has huge variations that will be concentrated away from the diagonal. Equation 7 is used to determine the contrast value from the matrix.
 →(7)
→(7)
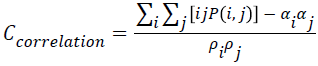
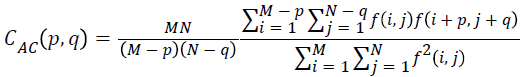
Correlation
The correlation value will be higher when an image contains a considerable amount of linear structure. It is measured using correlation through the Equation 8.
 →(8)
→(8)
Where,
Energy
The texture energy is measured by
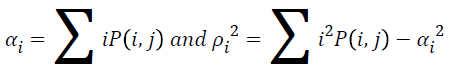 →(9)
→(9)
Homogenity
The combination of low and high values of P (i, j) in the cooccurrence matrix is used to found the homogeneity of an image. Mathematically representation of homogeneity can be expressed as
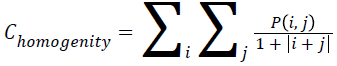 →(10)
→(10)
Maximum probability
This feature corresponds to the strongest response. This can be expressed mathematically as
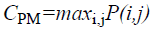 →(11)
→(11)
Local homogeneity, inverse difference moment (IDM)
IDM values are low for the inhomogeneous images and high for homogeneous images. It can be measured as
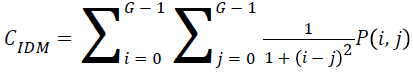 →(12)
→(12)
Auto correlation
The mathematical representation for autocorrelation is given by
 →(13)
→(13)
Directionality
Total degree of directionality can be calculated for the neighbours that are non-overlapping using Equation 14.
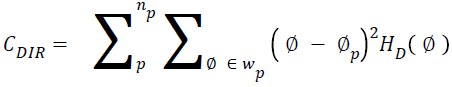 →(14)
→(14)
Coarseness
This feature is calculated for each pixel (x, y) in the image using the Equation 15. This represents the direct relationship to the repetition rate and scale.
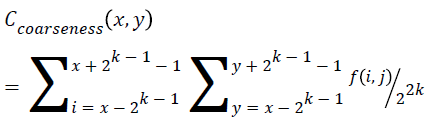 →(15)
→(15)
Other features
Cluster shade:
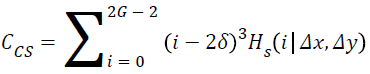 →(16)
→(16)
where, 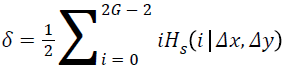
Cluster prominence:
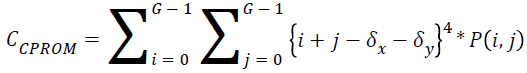 →(17)
→(17)
Inertia:
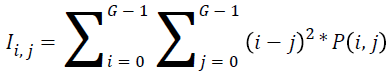 →(18)
→(18)
Cluster tendency:
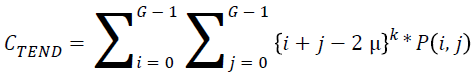 →(19)
→(19)
The subset of features can be chosen for a dimensionality diminishment from the extracted features. This is typically completed with a specific end goal in order to eliminate redundant and irrelevant features that are extracted. The determination procedure is done by utilizing joint entropy and genetic algorithm. From the extracted features only thirteen features were chosen. The entropy is evaluated for the features of the selected image that required to be predicted. This value is determined from a grayscale image, which measures the randomness present in the image to characterize the input image’s texture. This data is utilized to gauge and measure how an arbitrary variable can depict and affect other variable.
The fitness values for all the extracted features from the population initialization are estimated by genetic algorithm using the statistical information. The minimum relevance and maximum redundancy existence between the extracted features were determined by analysing the determined fitness values. If it fails to choose such a feature subset then they are processed again by the genetic algorithm. Otherwise, the chosen features are grouped to form a subset based on which prediction process is carried out.
Many researchers suggested Support Vector Machine (SVM) classifier as one of the best classifiers which can be opted for the breast cancer classification from mammogram images. It is independent of dimensionality and feature space. SVM transforms the input space to a higher dimension feature space through a non-linear mapping function. It constructs the separating hyperplane with maximum distance from the closest points of the training set. In this paper, the SVM classifier had been combined with linear kernel for improving the classification accuracy.
Results and Discussion
The classification of abnormal mammogram images was carried out using image processing tools in Matlab. The test images were collected from various scan centres and hospitals. A set of real time images had been tested along with the images from Min-MIAS database. A total of 1632 images were subjected for testing. The test images were pre-processed for noise removal, segmented for separation of interesting area and the features are extracted for classification.
The test image was pre-processed using ORNRAD filter and the denoised image was segmented using K-means clustering algorithm. The Figure 2 gives the input image, denoised image and segmented image for a test image.

Figure 2: (a) Test image (b) denoised image (c) segmented image.
The segmented images using K-means algorithm are then subjected to feature extraction. The selected feature values for 10 test images were given in Table 1. These selected feature values were used for training the classifier. The Figure 3 gives the screenshot for feature extraction of a sample input image.
| Sl. No | Mean | SD | Entropy | RMS | Variance | Smoothness | Volume | Breadth | Dimension | Contrast | Correlation | Energy | Homogeneity |
|---|---|---|---|---|---|---|---|---|---|---|---|---|---|
| Img1 | 0.0061 | 0.0896 | 3.531 | 0.0898 | 0.008 | 0.9577 | 22.66 | 1.085 | 0.124 | 0.301 | 0.075 | 0.769 | 0.935 |
| Img2 | 0.0029 | 0.0897 | 2.611 | 0.0899 | 0.008 | 0.916 | 10.89 | 0.9 | 0.358 | 0.284 | 0.148 | 0.803 | 0.944 |
| Img3 | 0.002 | 0.0897 | 2.321 | 0.0898 | 0.008 | 0.8836 | 7.588 | 0.778 | 0.0653 | 0.264 | 0.155 | 0.782 | 0.939 |
| Img4 | 0.0031 | 0.0897 | 2.433 | 0.0898 | 0.008 | 0.9217 | 11.78 | 0.834 | 0.0264 | 0.244 | 0.214 | 0.79 | 0.942 |
| Img5 | 0.0032 | 0.0897 | 2.237 | 0.0898 | 0.008 | 0.921 | 11.73 | 3.202 | 3.617 | 0.394 | 0.085 | 0.838 | 0.953 |
| Img6 | 0.004 | 0.0897 | 2.87 | 0.0898 | 0.008 | 0.938 | 15.24 | 1.749 | 0.661 | 0.301 | 0.156 | 0.805 | 0.944 |
| Img7 | 0.0041 | 0.0897 | 3.327 | 0.0898 | 0.008 | 0.939 | 15.37 | 0.636 | 0.086 | 0.251 | 0.117 | 0.745 | 0.929 |
| Img8 | 0.0041 | 0.0897 | 3.357 | 0.0898 | 0.008 | 0.938 | 15.27 | 1.496 | 2.666 | 0.312 | 0.09 | 0.801 | 0.944 |
| Img9 | 0.0035 | 0.0897 | 3.304 | 0.0898 | 0.008 | 0.93 | 13.39 | 2.024 | 3.09 | 0.365 | 0.061 | 0.798 | 0.943 |
| Img10 | 0.0031 | 0.0897 | 1.571 | 0.0898 | 0.008 | 0.919 | 11.35 | 1.582 | 0.0144 | 0.345 | 0.194 | 0.853 | 0.956 |
Table 1: Selected feature values.

Figure 3: Screenshot of feature extraction for a sample image.
The selected features were used to train the SVM classifier supported by linear kernel. The abnormal images were classified in three categories. The first category was based on the character of the background tissue and classified as fatty, fatty glandular and dense glandular. The second category was based on class of abnormality and classified as calcification, circumscribed masses, speculated masses, ill-defined masses, architectural distortion and asymmetric. The third category was based on severity of abnormality and classified as benign and malignant. The Figure 4 gives the screenshot for the classification of abnormality for a test image.

Figure 4: Screenshot of classification for a test image.
From the database of images created around 60% of the images were used for training and 40% for testing. The Table 2 shows the quantity of Region of Interest (ROI) used for training and testing of SVM classifier with linear kernel. Based on the class of abnormality, the images were grouped.
| Class | Training set | Testing set |
|---|---|---|
| Normal | 400 | 450 |
| CIRC | 75 | 58 |
| CALC | 95 | 76 |
| SPIC | 80 | 58 |
| MISC | 65 | 48 |
| ARCH | 70 | 62 |
| ASYM | 55 | 40 |
Table 2: Quantity of ROIs used for training and testing.
The performance of the proposed method was evaluated in terms of sensitivity, specificity and accuracy.
The percentage of sensitivity is given by
Sensitivity=Tp/(Tp+Fn) × 100%
Where Tp is the True positive and Fn is the False negative.
The percentage of specificity is given by
Specificity=Tn/(Tn+Fp) × 100%
Where Tn is the True negative and Fp is the False positive.
Accuracy is calculated by
Acc=(Tp+Tn)/(Tp+Fn+Tn+Fp) × 100%
The Table 3 shows the performance of the proposed method. The ROC curve of the proposed system is given in Figure 5.
| Set | TP | TN | FP | FN | SE (%) | SP (%) | AC (%) |
|---|---|---|---|---|---|---|---|
| Training | 425 | 400 | 10 | 5 | 98.83% | 97.56% | 98.20% |
| Testing | 326 | 450 | 9 | 7 | 97.89% | 98.03% | 97.97% |
Table 3: Performance analysis.

Figure 5: ROC curve of the proposed system.
The experimental results shows that in the training set 98.83% of the masses were identified correctly and 97.56% of the non-masses were labelled accurately. Likewise for the test set, these values were 97.89% for the masses and 98.03% for the nonmasses. The global accuracy considering the training and test set of data was 98.1%. The proposed classification system was compared with the existing systems and was given in Table 4.
| Authors | Extracted features | Classifier | Type of cancer | Image database | Accuracy (%) |
|---|---|---|---|---|---|
| Lan et al. [12] | Gray levels and texture | LR & KNN | Masses | DDSM | 86 |
| Nguyen et al. [13] | GLCM and Haralick | NN | Masses | MIAS | 88 |
| Zhang and Xie [14] | Histogram | TWSVM | Microcalcifications | DDSM | 96 |
| Llado et al. [15] | Region based LBP | SVM-RFE | Masses | DDSM | 94 |
| Proposed work | Texture & Tamura | SVM-Linear | CIRC, CALC, SPIC, MISC, ARCH, ASYM | MIAS & real time images | 98.1 |
Table 4: Comparison of performance of various methods.
The Table 4 shows that the performance of the proposed system is better in classification accuracy when compared with the existing methodologies.
Conclusion
An efficient abnormal mammogram images classification technique using support vector machine with linear kernel was proposed. The ROI was segmented using K-means clustering algorithm. The features were extracted using GSDM and Tamura method and the optimized features were selected using genetic algorithm along with joint entropy. The abnormality was classified into various categories by SVM with linear kernel. The classification accuracy was found to be high for the proposed method when compared with the existing methods. This can be further enhanced by the hybrid of various kernels along with SVM.
References
- Ramani R, Vanitha NS, Valarmathy S. The pre-processing techniques for breast cancer detection in mammography images. Int J Image Graph Signal Process 2013; 5: 47-54.
- Patil AA, Singhai J. Image denoising using curvelet transform: an approach for edge preservation. J Sci Ind Res 2010; 69: 34-38.
- Manas S, Mrinal KN, Chatterji BN. Soft, hard and block thresholding techniques for denoising of mammogram images. IETE J Res 2015; 61: 186-191.
- Valarmathi P, Radhakrishnan V. Tumor prediction in mammogram using neural network. Global J Com Sci Tech 2013; 13: 19-24.
- Ezhilarasu P, Suganthi J. Genetic algorithm optimized SVM for tumor prediction in mammogram. Life Sci J 2013; 10: 460-465.
- Vanitha NS, Ramani R. Computer aided detection of tumors in mammograms using optimized support vector machines. ARPN J Eng Appl Sci 2015; 10: 1660-1667.
- Htet TTT, Khin MMT. An approach for breast cancer diagnosis classification using Neural Network. Adv Comp Int J 2015; 6: 1-11.
- Saranya PK, Samundeeswari ES. A study on morphological and textural features for classifying breast lesion in ultrasound images. Int J Innov Res Sci Eng Technol 2016; 5: 3267-3279.
- Mohamed ME, Ibrahima F, Brahim BS. Breast cancer diagnosis in digital mammogram using multiscalecurvelet transform. Comput Med Imag Grap Elsevier 2010; 34: 269-276.
- Nalini S, Ambarish MG. Breast cancer mass detection in mammograms using k-means and Fuzzy C-means clustering. Int J Comput Appl 2011; 22: 15-21.
- Rajesh A, Mohan Ellappan. Classification of mammogram using wave atom transform and support vector machine classifier. Int J Comput Sci Inf Technol 2016; 7: 467-470.
- Lan Y, Ren H, Wan J. A hybrid classifier for mammography. Fourth International Conference on Computational and Information Sciences 2012; 309-312.
- Nguyen V, Nguyen D, Nguyen H, Bui D, Nguyen T. Automatic identification of massive lesions in digitalized mammograms. Fourth International Conference on Communications and Electronics 2012; 313-317.
- Zhang X, Xie H. A new approach for clustered microcalcifications detection. Asia Pacific Conference on Information Processing 2009; 322-325.
- Llado X, Oliver A, Freixenet J, Marti R, Marti J. A textural approach for mass false positive reduction in mammography. Comput Med Imaging Graph 2009; 33: 415-422.
- Shweta S, Kavita B. A survey on neural network techniques for classification of breast cancer data. Int J Eng Adv Technol 2012; 2: 234-237.
- Yu S, Guan L. A CAD system for the automatic detection of clustered microcalcifications in digitized mammogram films. IEEE Trans Med Imaging 2000; 19: 115-126.
- Nithya K, Aruna A, Anandakumar H, Anuradha B. A survey on image denoising methodology on mammogram images. Int J Sci Tech Res 2014; 3: 92-93.
- Ravishankar S, Jain A, Mittal A. Automated feature extraction for early detection of diabetic retinopathy in fundus images. IEEE Conf Comp Vis Patt Recogn 2009; 210-217.
- Khayat O, Ghergherehchi, Afarideh H, Durrani SA, Pouyan Ali A. Feature extraction and track measurement for low resolution images; a cost effective method. J Radiat Meas 2013; 50: 228-231.